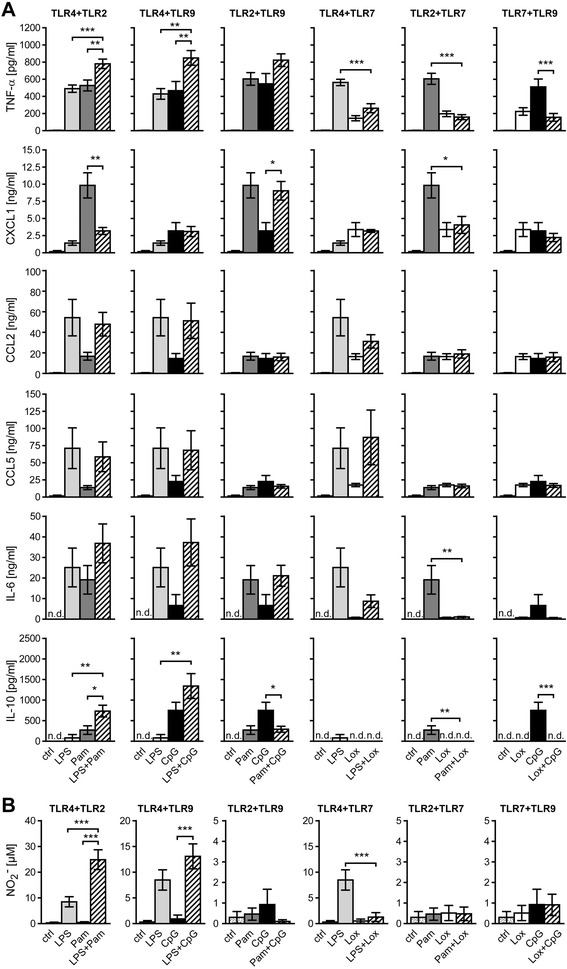
Figure 2.

Pairwise TLR activation results in a distinct profile of cytokines and chemokines in microglia. Purified microglia were stimulated with LPS (100 ng/mL), Pam3CysSK4 (Pam, 100 ng/mL), loxoribine (lox, 1 mM), or CpG ODN (CpG, 1 μM) alone or simultaneously with pairwise combinations of the ligands, as indicated. PBS served as control. Supernatants were analyzed by (A) TNF-α ELISA (mean ± SEM of five independent experiments run with duplicates) and flow cytometry-based multiple analyte detection for several cytokine/chemokine levels, as indicated (mean ± SEM of four independent experiments) after 24 h, or by (B) Griess reaction for NO content (mean ± SEM of five independent experiments run with duplicates) after 48 h. ANOVA with Bonferroni-selected pairs of each individual ligand vs. combination of ligands, as indicated. P* <0.05; P** <0.005; P*** <0.001; n.d., not detected.
