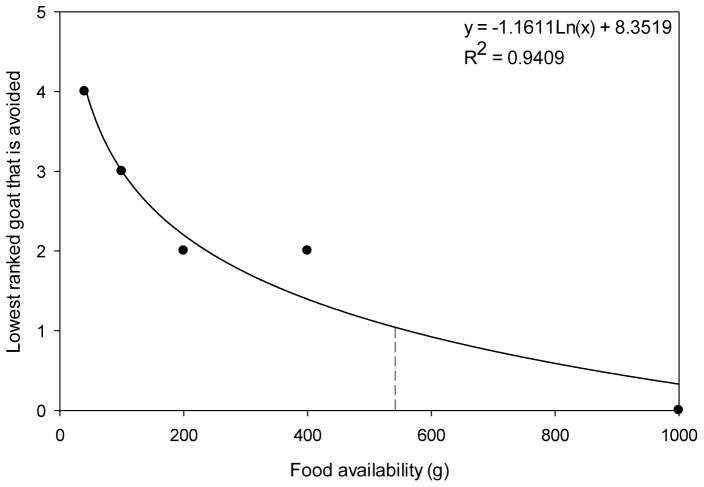
Figure 5. Change in the number of top ranked individuals avoided by patch-joiners as food availability increases.
Y-axis represents the lowest ranked goat of the top four ranked individuals that was avoided. Ranking is set so that rank 4 indicates that the top four highest ranked goats were avoided, 3 the top three, 2 the top two and 1 only the top goat was avoided. Dashed line indicates the amount of food (∼563 g) where the most dominant individual was not avoided by patch-joining goats, and thus where the quantity of food within a patch overcame dominance as the main factor influencing patch-joining decisions.

