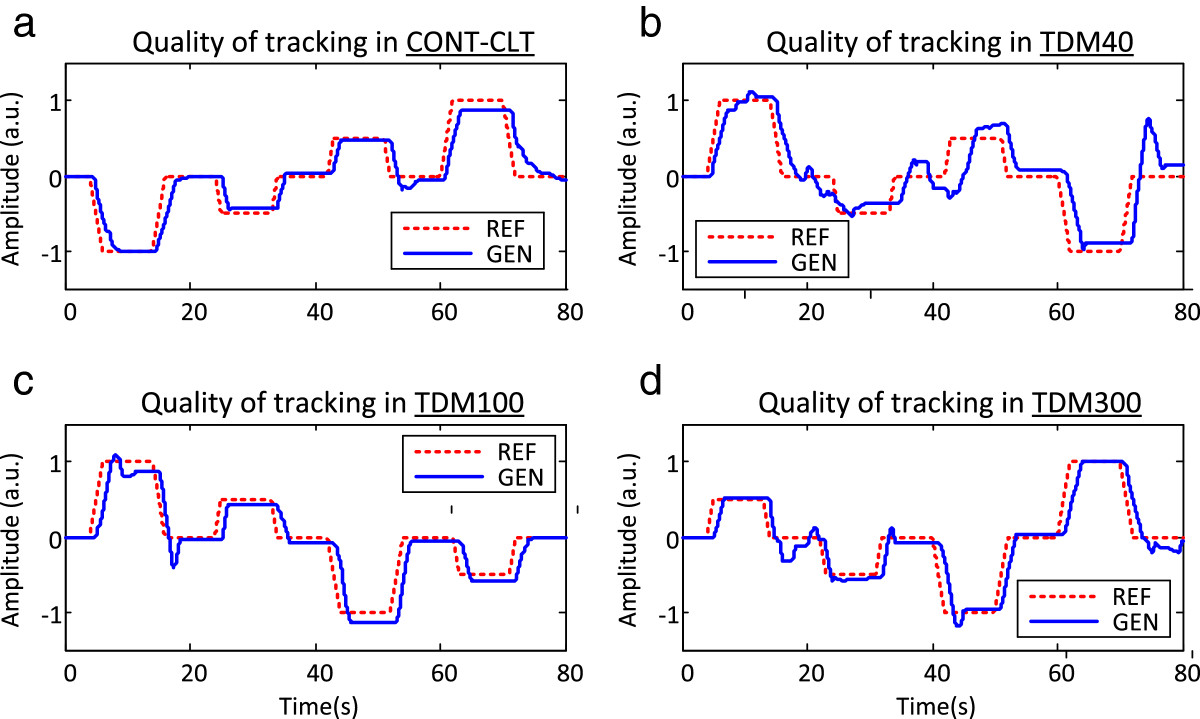
Figure 4.

The reference (red, dashed line) and generated (blue, solid line) trajectories for one subject in the four tested conditions. The plots are for a) continuous feedback (CONT-CLT), and TDM using feedback window of b) 40 ms (TDM40), c) 100 ms (TDM100), and d) 300 ms (TDM300). The quality of tracking was the best in CONT-CLT, similar in TDM100 and TDM300, and much worse for the shortest feedback window in TDM40.
