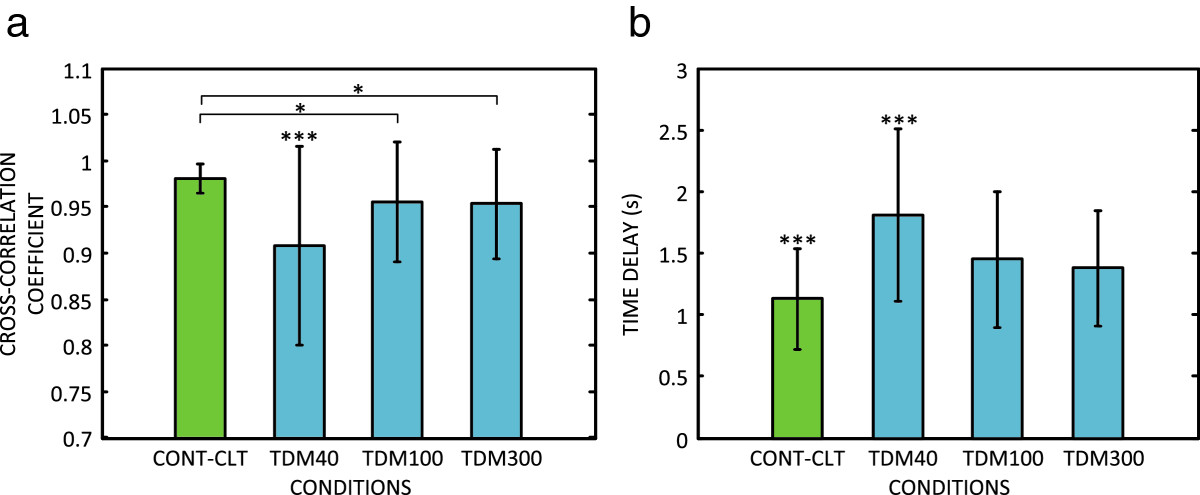
Figure 5.

Average results (mean ± standard deviation) across conditions: a) cross-correlation coefficient and b) time delay between the reference and generated trajectory. Horizontal bar with asterisks indicates the statistically significant difference between the respective conditions. Asterisks only indicate that a group is significantly different from all the other conditions. Notation: CONT-CLT – continuous feedback, TDM40, TDM100, TDM300 – time–division multiplexing (TDM) with 40 ms, 100 ms, and 300 ms feedback window length. (*, p < 0.05; **, p < 0.01; ***, p < 0.001).
