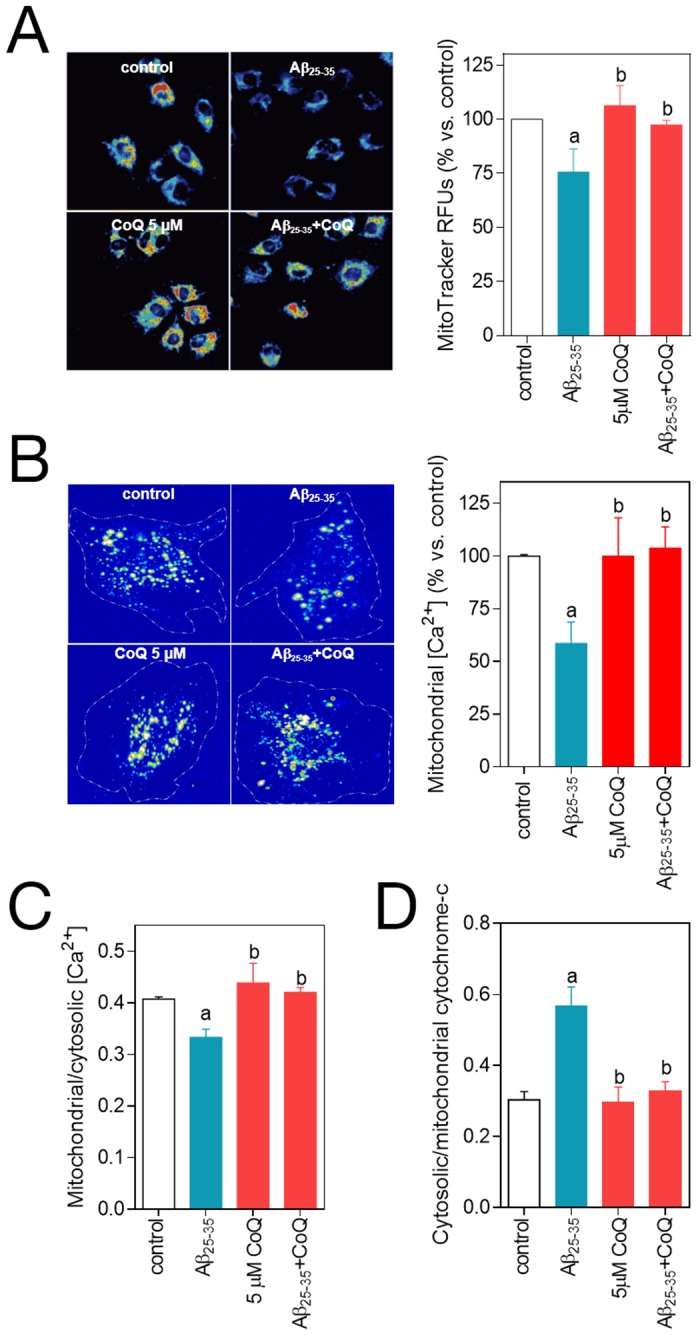
Figure 7. CoQ impedes β-amyloid-induced mPTP opening.

HUVECs were incubated for 12 h with vehicle or 5 µM CoQ and treated for additional 3–24 h with 5 µM Aβ25–35. The effect of the treatments on mPTP opening was quantified indirectly by measuring MitoTracker Deep Red fluorescence, mitochondrial Ca2+ and cytochrome c release. After treatment with 5 µM Aβ25–35, mitochondria were loaded with MitoTracker Deep Red A), Calcein-AM and CoCl2 B) and MitoTracker Deep Red plus Fluo-4 C). Fluorescence intensity for each probe was determined by fluorescence microscope in living cells (n = 3/4). Mitochondrial Ca2+ levels were calculated by quenching the cytosolic Calcein-AM signal with CoCl2 B) and by colocalization of Fluo-4 and MitoTracker and furfher image processing with ImageJ C). Cells were loaded with Mitotracker Deep Red and immunostained with an anti-cytochrome c D). The amount of cytochrome c in cytosol was calculated by colocalization and image processing with ImageJ (n = 3). Results show the percentage of relative fluorescence units (RFUs) vs. control cells or the ratio between cytosolic/mitochondrial Fluo-4-AM or cytochrome c RFUs level. a, p<0.05 vs. control; b, p<0.05 vs. Aβ25–35.
