Figure 4.

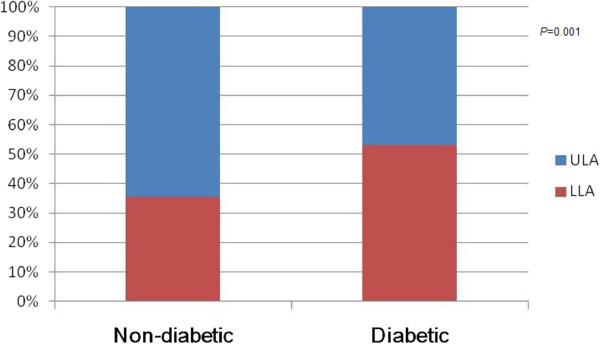
Bar graph demonstrates the main distribution of plaques between diabetic and non-diabetic patients, showing the increased distal segment involvement in diabetic patients ( P = 0.01) . ULA = Upper Leg arteries, LLA = Lower leg arteries.

Bar graph demonstrates the main distribution of plaques between diabetic and non-diabetic patients, showing the increased distal segment involvement in diabetic patients ( P = 0.01) . ULA = Upper Leg arteries, LLA = Lower leg arteries.