Figure 2.
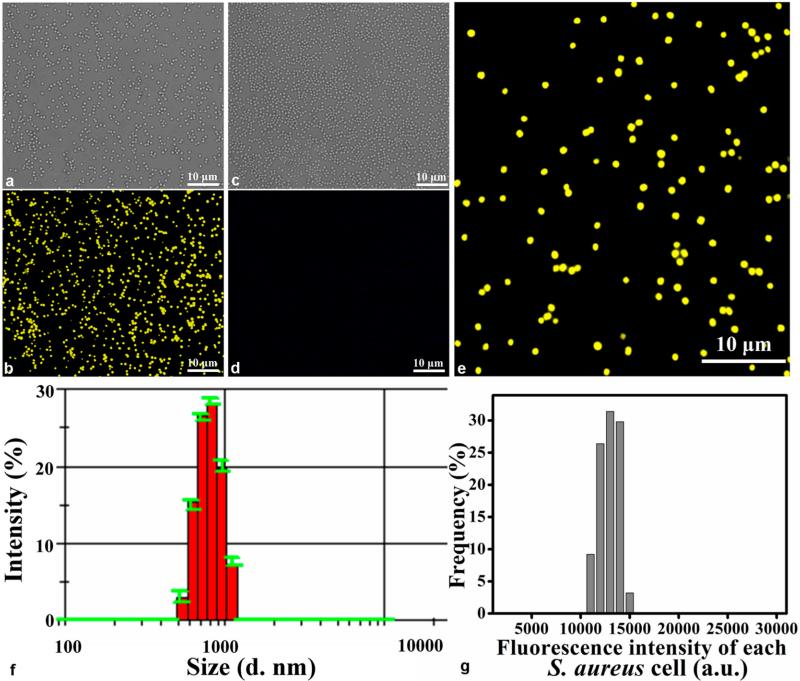
Characterization of cellular beacons. (a, b) Bright and fluorescent field images of cellular beacons (i.e., cultured with Na2SeO3 and CdCl2), respectively. (c, d) Corresponding images for the control of cells cultured neither with Na2SeO3 nor CdCl2. (e) Enlarged panel of the boxed region in (b), showing perfectly uniform size and strong fluorescence of the individual cells. (f) Histogram showing the size distribution of cellular beacons, with the average hydrodynamic diameter of the cellular beacons at about 800.7 nm with a PDI of 0.082. (g) Histogram showing the fluorescence intensity distribution of the cellular beacons based on the measurement of the intensity of 500 individual cells in a fluorescence image.

