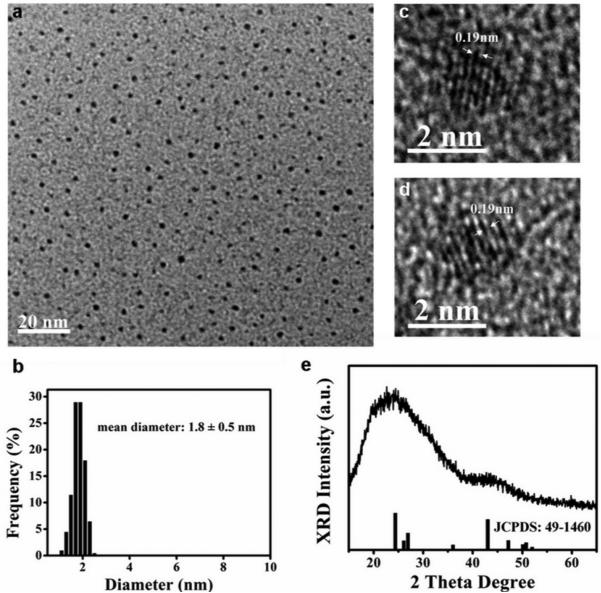
Figure 5.
In situ HRTEM for intracellular CdS0.5Se0.5 QDs and the characterization of the isolated CdS0.5Se0.5 QDs from the cellular beacons. (a) TEM image of monodispersed isolated CdS0.5Se0.5 QDs. (b) Size distribution histogram of the isolated CdS0.5Se0.5 QDs, with the median diameter of 1.8 ± 0.5 nm. (c) HRTEM image of the isolated CdS0.5Se0.5 QDs. (d) In situ HRTEM image of intracellular CdS0.5Se0.5 QDs. (e) XRD patterns of CdS0.5Se0.5 QDs. The lines under the spectrum represent the JCPDS pattern for CdS0.52Se0.48.

