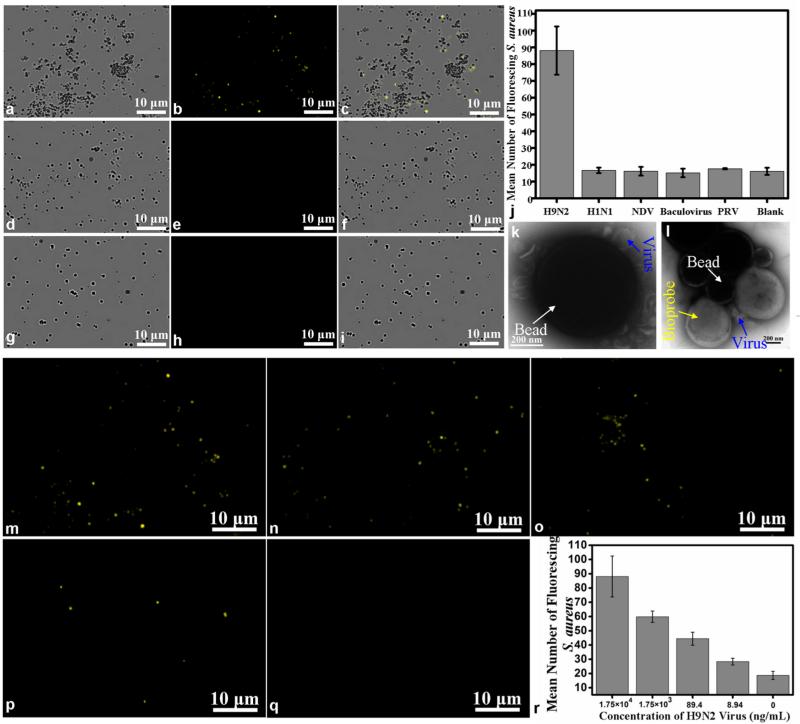
Figure 6.
Fluorescent-biotargeting cells are very specific for the desired target. TEM images of fluorescent-biotargeting cells as probes for virus detection and bead–virus composites. The binding of the bioprobe to the immunomagnetic beads is proportional to H9N2 AIV concentrations. The concentration of H9N2 AIV is 1.75 × 10⁴ ng/mL, while the concentrations of the negative control virus were 100 times as high as that of H9N2 AIV. The fluorescence images of H9N2 AIV sample (b), control sample H1N1 (e), and blank sample (h). Bright fields from the corresponding areas of H9N2 sample (a), H1N1 sample (d), and buffer blank (g), respectively. The merging of a and b (c), d and e (f), and g and h (i). (j) Histogram showing the amount of fluorescent probes bound to the positive sample (H9N2 AIV) and controls (inactive H1N1, NDV, baculovirus, PRV, and blank). (k) The bead–virus composites were negatively stained with phosphotungstic acid for TEM observation. The blackish round spots are the beads, while the smaller spots are characteristic of virion morphology around the beads, which showed the virons. (l) TEM image of beads–virus–bioprobe composites. (m, n, o, p, q) Fluorescence images of the detection of H9N2 AIV at different concentrations (1.75 × 10⁴, 1.75 × 10³, 89.4, 8.94, and 0 ng/mL, respectively). (r) Histogram showing the number of bioprobes captured on the beads in the presence of different concentrations of H9N2 virus.

