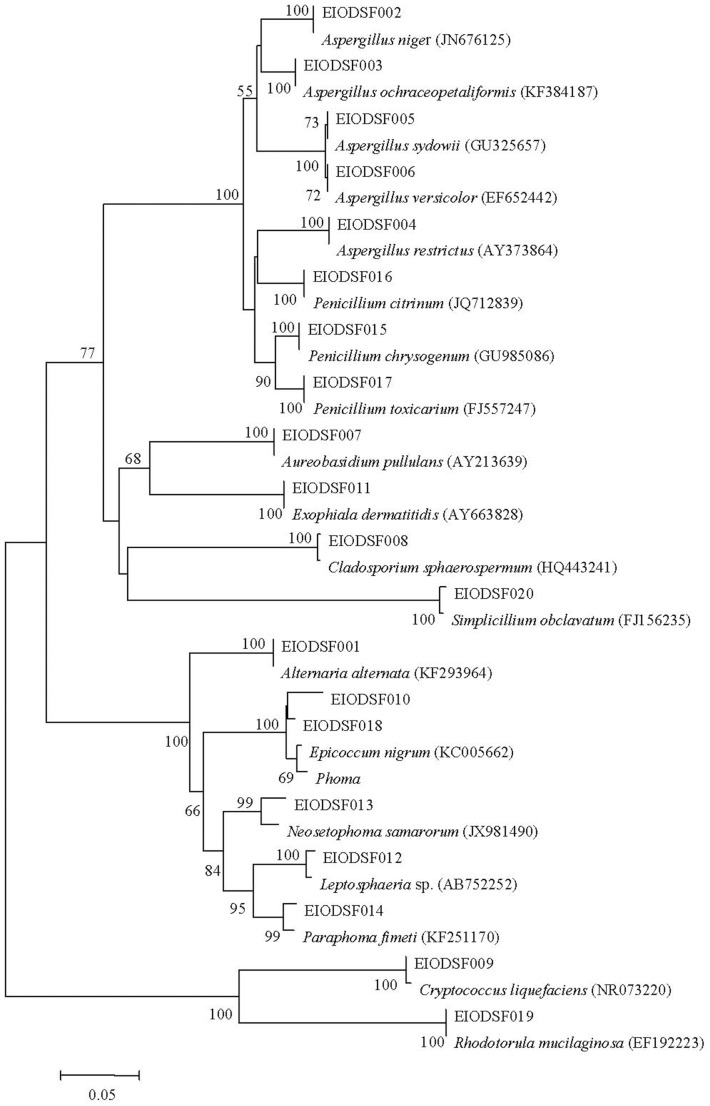
Figure 3. Neighbor-joining phylogenetic tree from analysis of ITS sequences from fungi isolated from five deep-sea sediments from the East Indian Ocean.
The numbers at the nodes are the percentages indicating the level of bootstrap support based on a neighbor-joining analysis of 1000 resampled data sets. Only values >50% are shown. The scale bar represents 0.05 substitutions per nucleotide position.

