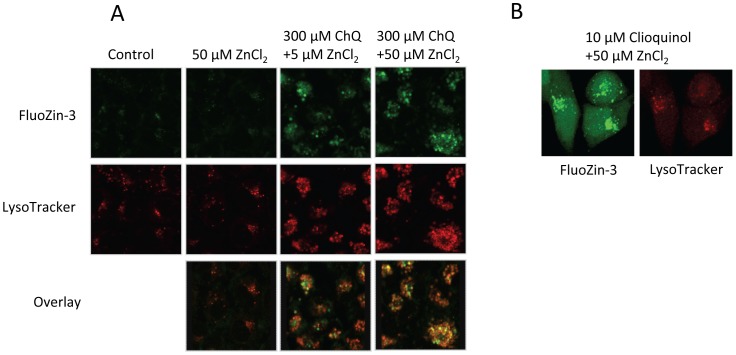
Figure 4. Intracellular zinc ion distribution in A2780 cells after chloroquine treatment.
A. A2780 cells were plated in a 6-well plate and treated with chloroquine (ChQ) and ZnCl2 at the indicated concentrations for 1 hour. After addition of the FluoZin-3 and LysoTracker probes, the cells were examined by confocal microscopy (excitation, 490/20 nm, emission, 528/38 nm for FluoZin-3; 555/28 nm, 617/73 nm for LysoTracker, respectively). Shown are representative images from three individual experiments. B. A2780 cells were plated in a 12-well plate and treated with clioquinol (CQ) and ZnCl2 at the indicated concentrations for 1 hour. Confocal images were captured as we previously described [17].

