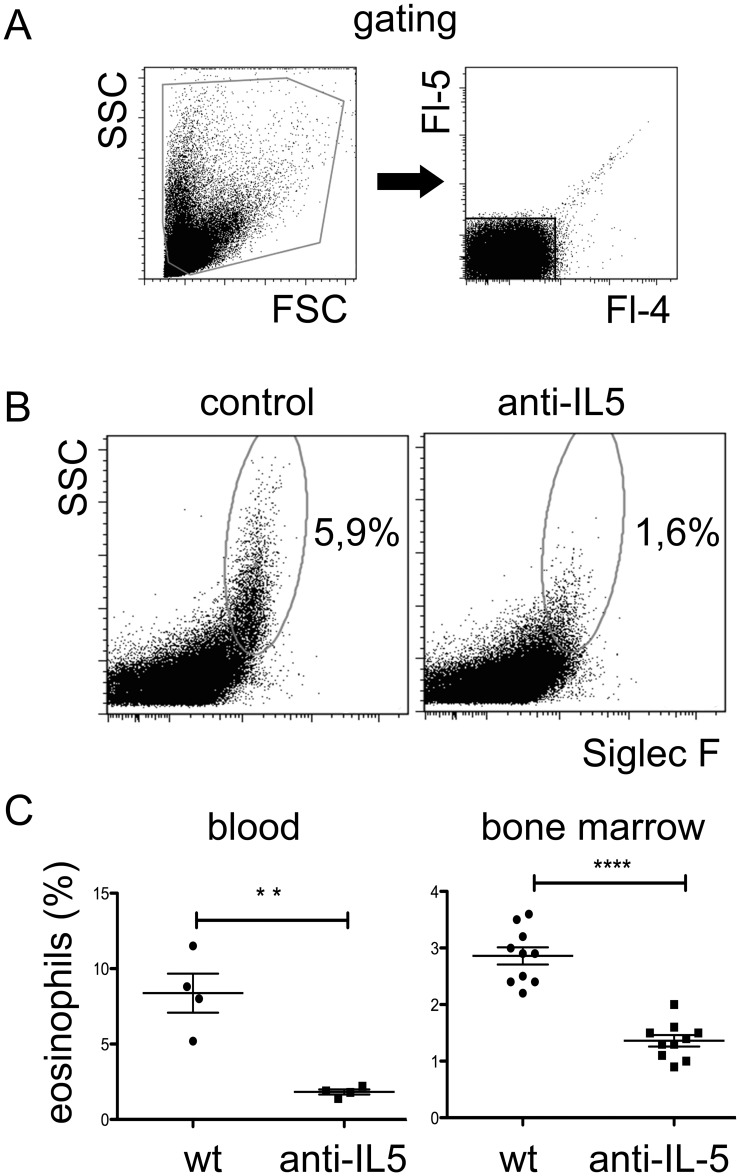
Figure 3. Anti-IL-5 treatment efficiently depletes eosinophils from blood and bone marrow.
Mice received single injections of one mg/ml anti-IL-5 blocking antibody. Eosinophils were quantified by flow cytometry. (A) Gating strategy: cells were electronically gated through a forward scatter (FSC)/side scatter (SSC) gate followed by exclusion of autofluorescent cells by using two irrelevant fluorescence parameters (Fl-4 and Fl-5). In addition, doublets were excluded according to light forward scatter width (not shown). (B) Eosinophils are identified by Siglec-F expression and SSC. Representative data are shown from blood of PBS treated control mice and mice receiving anti-IL-5 blocking antibody, as indicated. (C) Average eosinophil frequencies in blood and bone marrow one week after injection of anti-IL-5 or control antibodies. Each dot represents the eosinophil frequency of an individual mouse. Mean +/− SEM are shown (statistics: Mann-Whitney U test; ** = P≤0.05, *** = P≤0.001).

