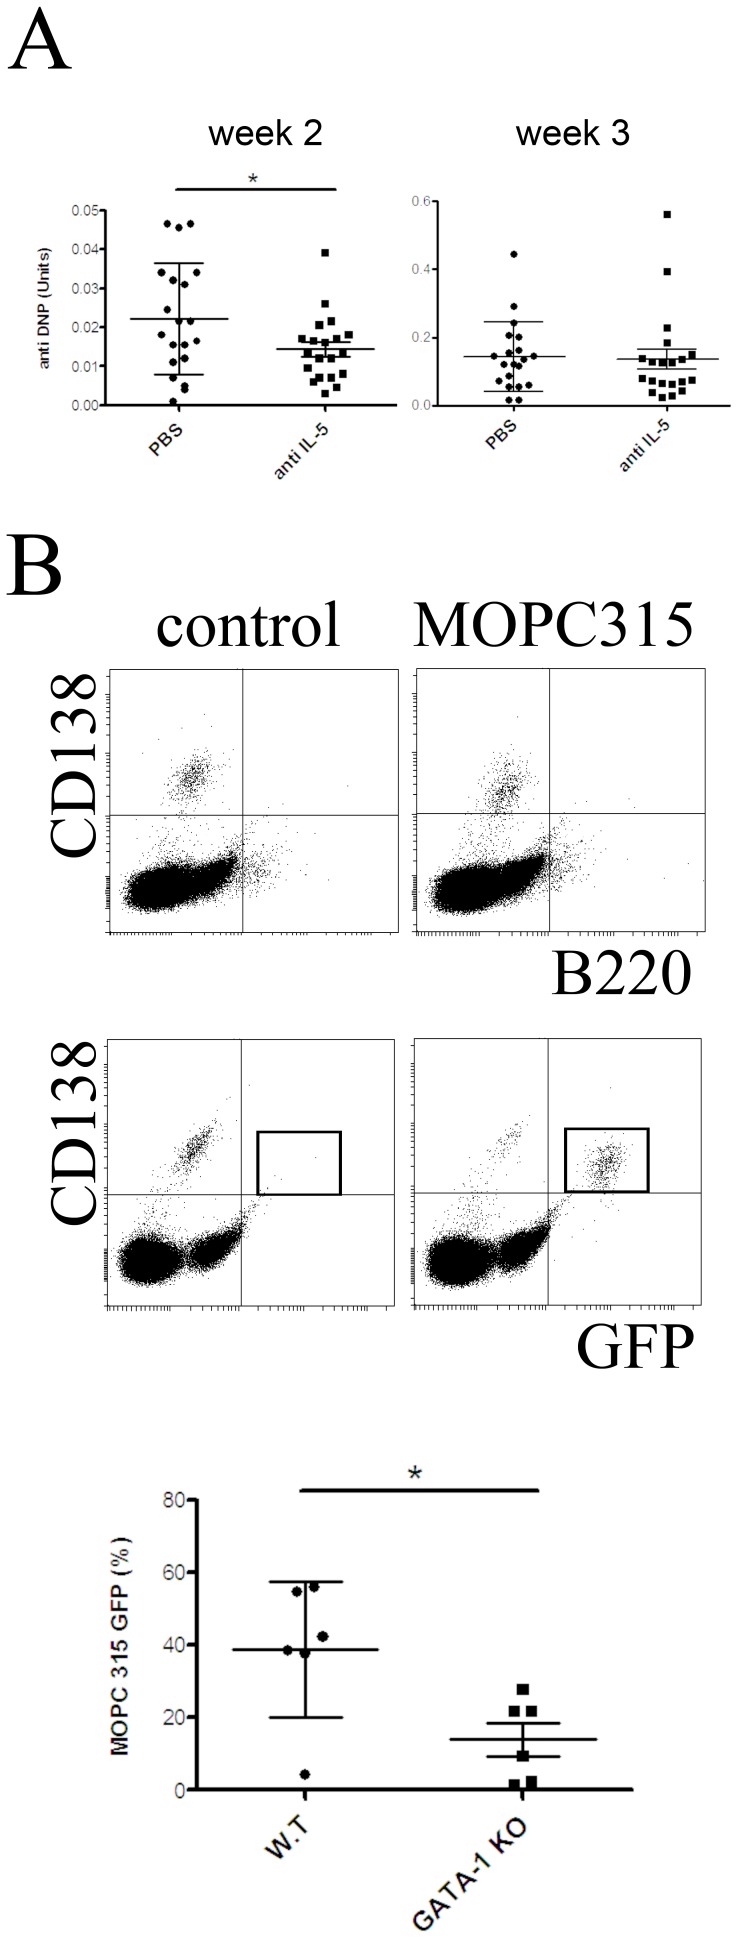
Figure 4. Eosinopenia impairs MOPC315.BM myeloma growth in vivo.
(A) In order to induce eosinopenia mice were treated with anti-IL-5 blocking antibody. One week later, 5×10⁵ MOPC315.BM cells were injected and myeloma load was determined by quantification of myeloma-specific serum protein (anti-DNP) by ELISA. Each dot represents myeloma specific protein from one mouse at week two after myeloma cell injection (statistics: unpaired t-test; * = P≤0.05). (B) Top: Example of flow cytometric analysis of CD138, B220 and GFP expression in bone marrow of mice that four weeks earlier received either MOPC315.BM transfected with eGFP, or PBS (control). MOPC315 cells were identified according their high level expression of GFP (as indicated by quadrant). Bottom: eGFP-labeled MOPC315.BM cells were injected into eosinophil deficient ΔdblGATA-1 mice and wild type mice, both on a BALB/c background. Two weeks after injection, eGFP-labeled myeloma cells were quantified in the bone marrow by flow cytometry. Each dot represents MOPC315.BM counts in one mouse. Data shown in part A and B represent data from two independent experiments. Mean +/− SD are shown (statistics: Mann-Whitney U test; * = P≤0.05).

