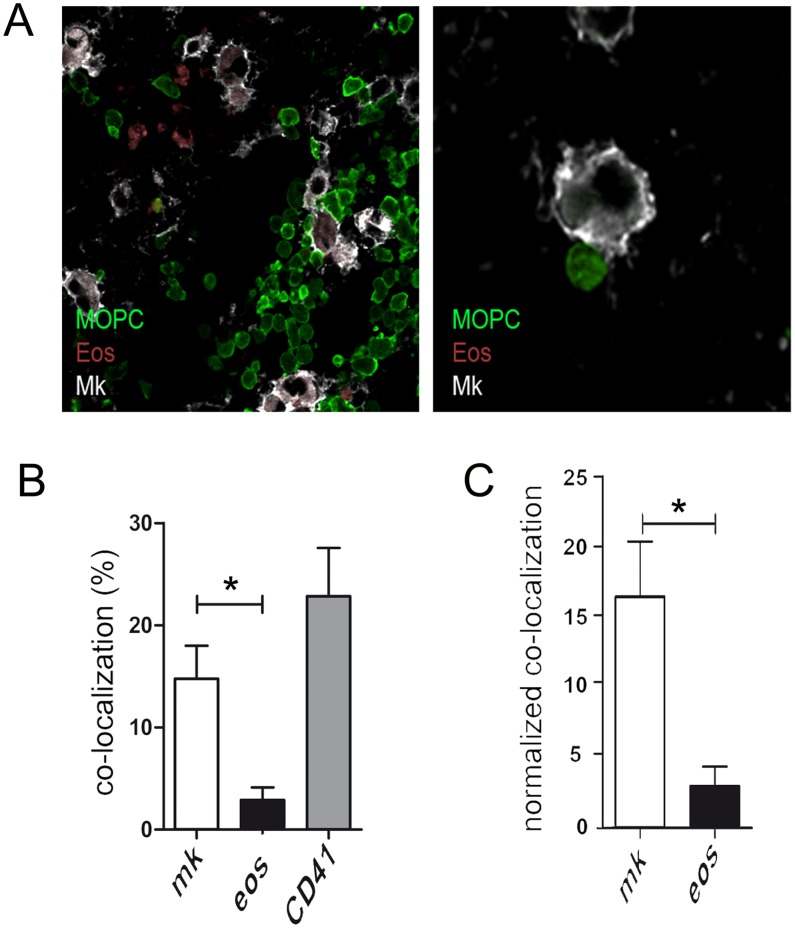
Figure 6. MOPC315.BM myeloma cells co-localize with megakaryocytes in vivo.
Cryosections of murine bone marrow (femur) from mice with moderate load of eGFP-labelled MOPC315 BM cells. (A) Sections were stained for eosinophils (MBP, red) megakaryocytes (CD41, white). MOPC315 BM cells were identified by eGFP (green). Analysis was performed with a Olympus IX81 confocal microscope using a 20x oil objective and processed with Olympus microscope and Adobe Photoshop software. Left: representative picture from a femur exhibiting intermediate myeloma load. Right: myeloma cells often make direct contact to megakaryocytes. (B) In femurs of three mice a total of 1244 MOPC315.BM myeloma cells were screened for their contacts to MBP+ eosinophils and CD41+ megakaryocytes, respectively. Contacts to CD41+ “particles” which could not clearly morphologically identified as a megakaryocyte were counted separately. Left: Bars show the respective co-localization frequencies for myeloma cells Right: Contact frequencies normalized on the total cell surface areas of megakaryocytes and eosinophils, respectively. Normalized data presented as contacts of one hundred myeloma cell to one square micrometer of the respective niche cell. One experiment was performed. Mean +/− SD are shown (statistics: Mann-Whitney U test; * = P≤0.05).

