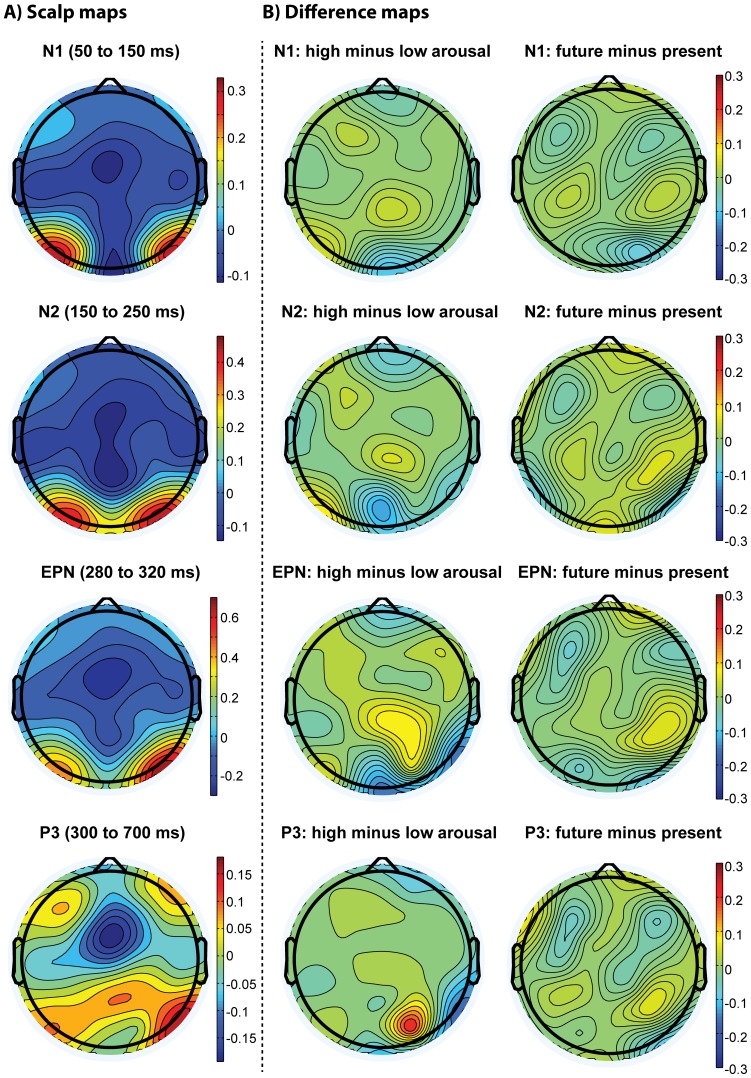
Figure 3. Scalp distributions of differences in CSD-ERPs.
The left column displays scalp maps for the average distribution of voltage for the N1 (50 to 150 ms), the N2 (150–250 ms), the EPN (280 to 320 ms) and the P3 (300 to 700 ms) time windows. The middle column visualises the difference maps for arousal (high minus low), and the right column displays the difference maps for time reference (future minus present) for the same ERP components.

