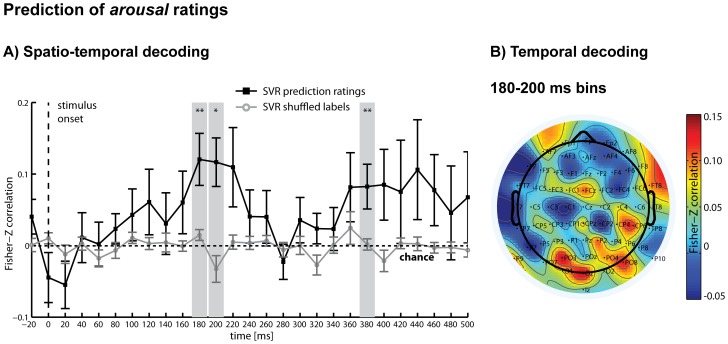
Figure 4. SVR results for arousal ratings.
A) Spatio-temporal decoding: Multivariate support vector regression (SVR) was used to regress arousal ratings (in increments: low/medium/high) from distributed patterns of CSD-ERPs within analysis time windows of 40 ms that were moved through the first 500 ms of each trial in steps of 20 ms. Ratings could be regressed significantly above chance between 180–200 ms (denoting the central time points of the analysis windows) and again around 380 ms after stimulus presentation (black line). Additionally shown are the results of the same SVR analysis using shuffled labels to obtain an empirical chance distribution for statistical testing (grey line). B) Temporal decoding: Multivariate SVR was used for each channel separately to regress arousal ratings (in increments: low/medium/high) from purely temporal patterns of CSD-ERPs within the first significant time period of the spatio-temporal analysis (combined time bins 180 ms and 200 ms). The heat map illustrates predictive channels, with electrodes P9 (t(14) = 2.59*), PO3 (t(14) = 2.24*), O1 (t(14) = 2.46*), P6 (t(14) = 2.46*), PO4 (t(14) = 2.87*) reaching significance. *P<.05; **P<.01 (uncorrected); error bars = standard errors.

