
Figure 10.
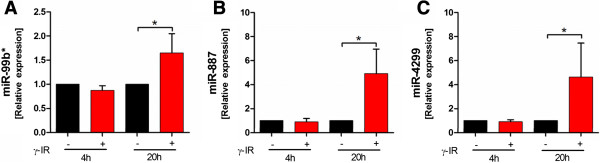
Validation of the miRNA data by qPCR. qPCR revealed a strong correlation between the microarray and PCR data. Expression values were normalized relative to values in non-irradiated PBMCs. The expression of miR-99b* (A), miR-887 (B), and miR-4299 (C), was significantly higher in irradiated PBMCs compared to non-irradiated PBMCs 20 hours after irradiation. Relative gene expression levels were calculated based on the mean value of four samples using the comparative Ct method. RNU44 served as internal reverence miRNA. Data are presented as the mean + SD. *p < 0.05, paired T-test; n = 4.