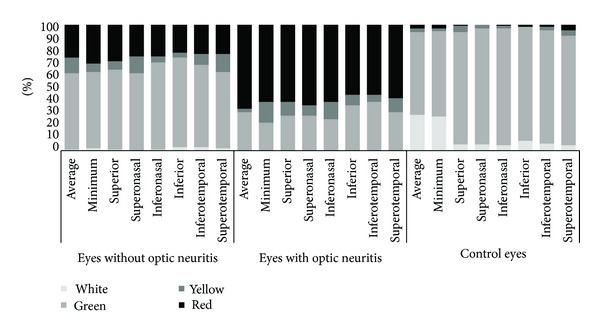
Figure 2.

Comparison of the color scale frequency for each sector using ganglion cell-inner plexiform layer analysis with Cirrus optical coherence tomography among eyes with and without optic neuritis in relapsing-remitting multiple sclerosis patients and from healthy control subjects. Black represents eyes classified as red (below percentile 1); dark gray represents eyes labeled as yellow (below percentile 5); light gray represents green (between percentiles 5 and 95), and white represents white (above percentile 95).
