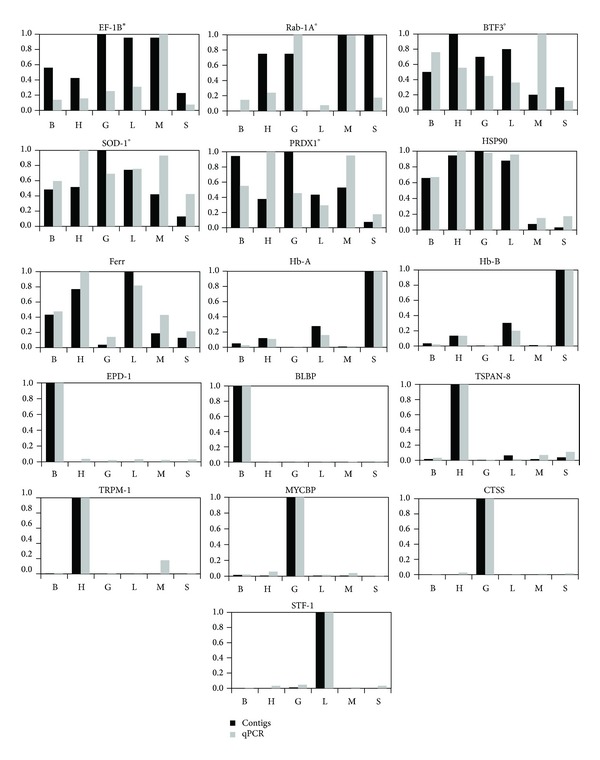
Figure 3.

Comparative plots of relative expression as contig frequencies versus mean qPCR values for all genes selected for this study. Codes for each of the gene are listed in Table 1, S = spleen, B = brain, H = heart, G = gonad, L = liver, and M = muscle; the correlation coefficient (Pearson's r) resulted to be highly significant (P < 0.0001) for most of the genes except for *P < 0.05 and °not significant.
