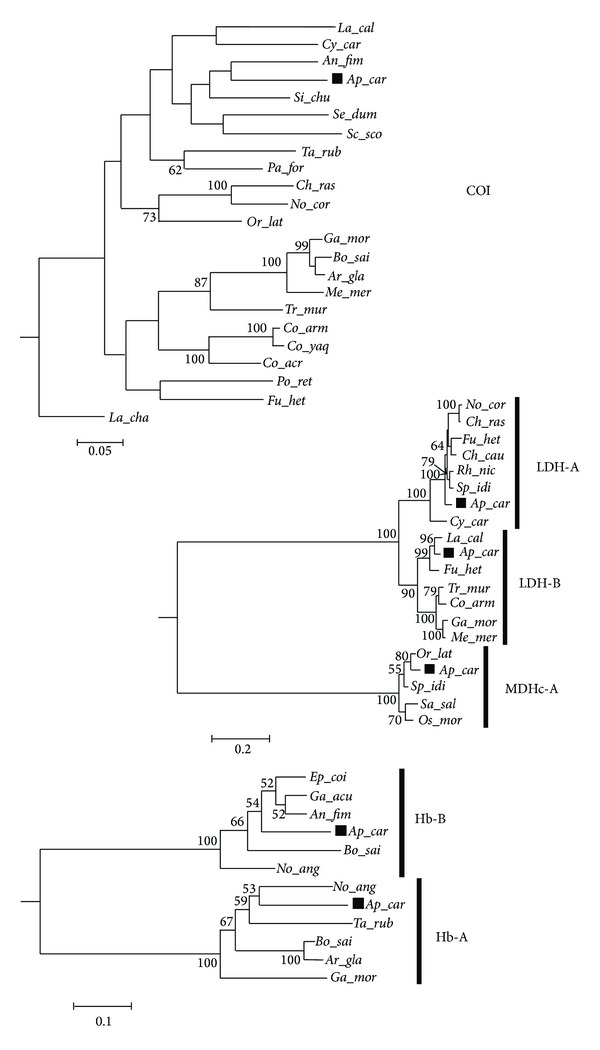
Figure 4.

At the top: molecular phylogenetic tree of COI gene estimated by the HKY nucleotide substitution model constructed by neighbor joining and rooted including the sequence of Latimeria chalumnae (acc. nr.: NC_001804); in the middle: NJ tree of LDH and MDH genes; and at the bottom: NJ tree of globin (Hb) gene. Numbers in proximity of the nodes denote the bootstrap value (above 50%) out of 1000 replicates. The scale indicates the evolutionary distance of the base substitution per site. Taxon coding includes the first two letters for the genus followed by three letters for the species name (see Table 6). A black square helps to locate Aphanopus carbo in the trees.
