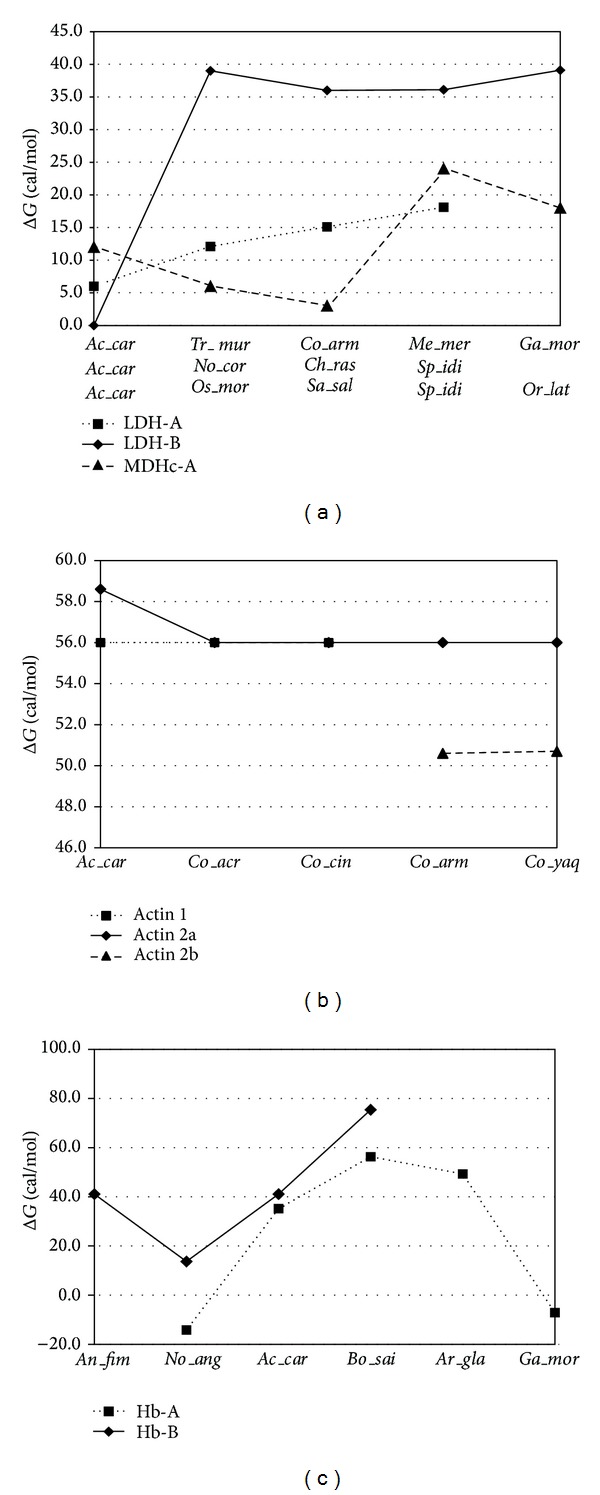
Figure 5.

Comparative plots of normalised difference in protein stability (ΔG) for different functional genes among several representative species. Taxon coding includes the first two letters for the genus followed by three letters for the species name (see Table 6).
