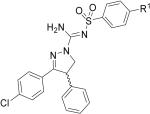
Table 1.
IC50 and Ki values for the CBL1 and CB2 receptors and cLogP data for ligands 2, (-)-12a, (+)-12a, (-)-12c and (+)-12c. 
| Ligand | R1 | CB1 IC50 (nM)a | CB2 IC50 (nM)a | CB1 Ki (nM)a | CB2 Ki (nM)a | cLogPb |
|---|---|---|---|---|---|---|
| 2 | 2.2 ± 0.5 | 4,570 ± 410 | 0.4 ± 0.1 | 697 ± 63 | 6.95 | |
| (-)-12a | CN | 2.8 ± 0.3 | > 33,000 | 0.5 ± 0.1 | > 5,000 | 3.85 |
| (+)-12a | CN | 100 ± 10 | > 33,000 | 16.9 ± 2.0 | > 5,000 | 3.85 |
| (-)-12c | I | 1.9 ± 0.7 | > 33,000 | 0.3 ± 0.1 | > 5,000 | 5.07 |
| (+)-12c | I | 103.5 ± 9.0 | > 33,000 | 17.4 ± 2.0 | > 5000 | 5.07 |
Values are represent the mean ± SD of three determinations.
cLogP values were calculated by using the Pallas 3.0 software (Compudrug, USA).
