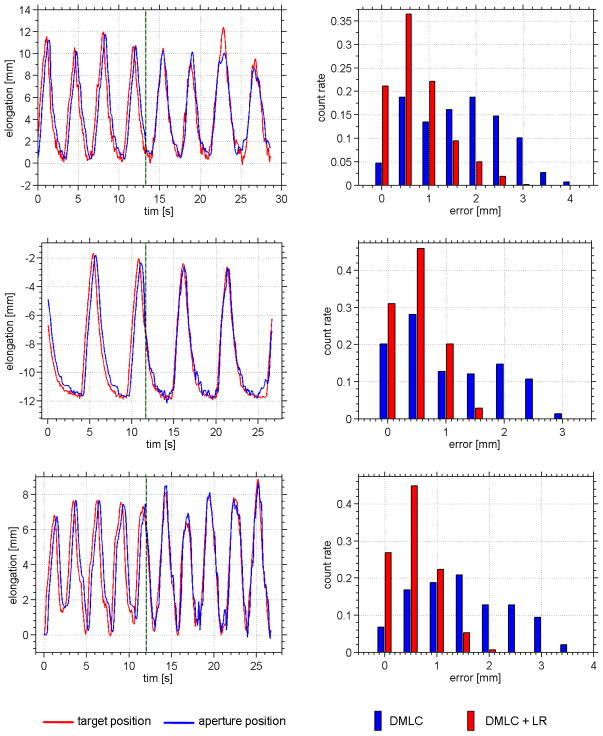
Figure 4.
Experimental results of the physical phantom study (cf Table 2 ). Each row refers to the delivery of one lung tumor trajectory. The target position (red) and the aperture position (blue) are plotted over time. The black/green dotted line denotes the start of prediction. (right column) Error histograms for each trace before prediction is in place (blue) and after (red). The histogram is normalized to unity integral counts.

