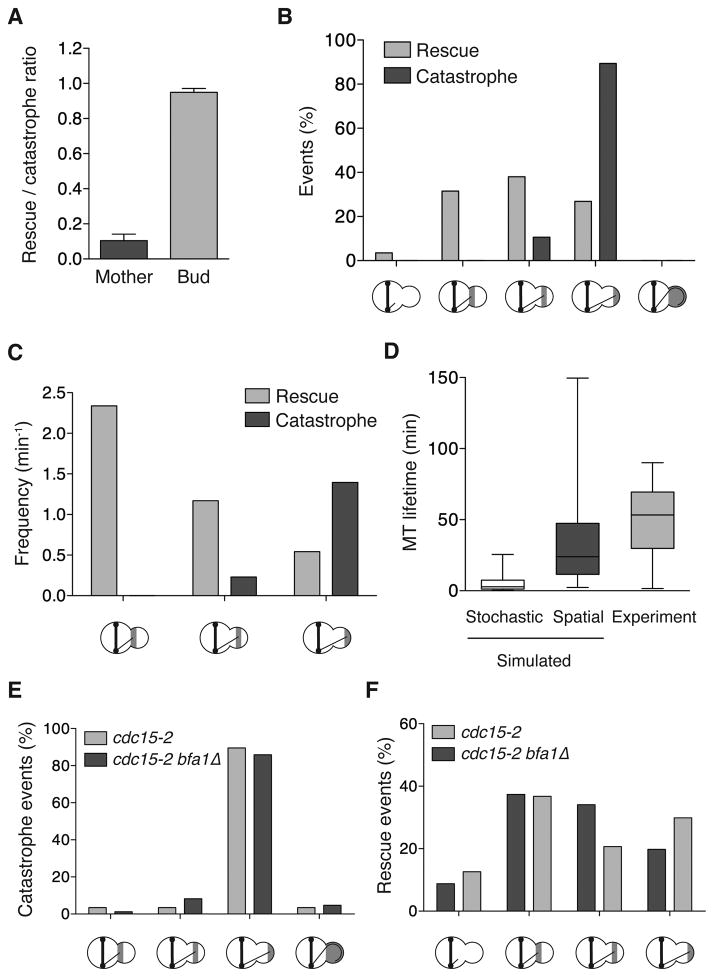
Figure 2. Spatial regulation of catastrophe and rescue extends microtubule lifetime in the bud and is independent of the SPOC.
(A) MT rescue to catastrophe ratio. Mean ± SEM. n > 41 for both. P < 0.0001. (B) Location of rescue and catastrophe in the bud. The X-axis demarks events within each third of the bud. The left category represents MTs that depolymerize out of the bud. The right represents MTs that overgrow the bud and curl around the bud tip prior to catastrophe. n > 169 for both. (C) Rescue and catastrophe frequencies, calculated from 119 and 99 minutes of growth and shortening time, respectively. (D) Simulated MT lifetime within the bud. The Stochastic category applies the mean bud-specific transition frequencies as in Figure 1D. The Spatial category applies the spatially resolved frequencies shown in (C) within each third of the bud. n = 200 for both. The Experiment category is the observed lifetime from Figure 1C. (E and F) Location of MT transitions in control (dyn1Δ cdc15-2) and dyn1Δ cdc15-2 bfa1Δ cells (37°C, 1 h). n > 85 for each category. See also Figure S2.

