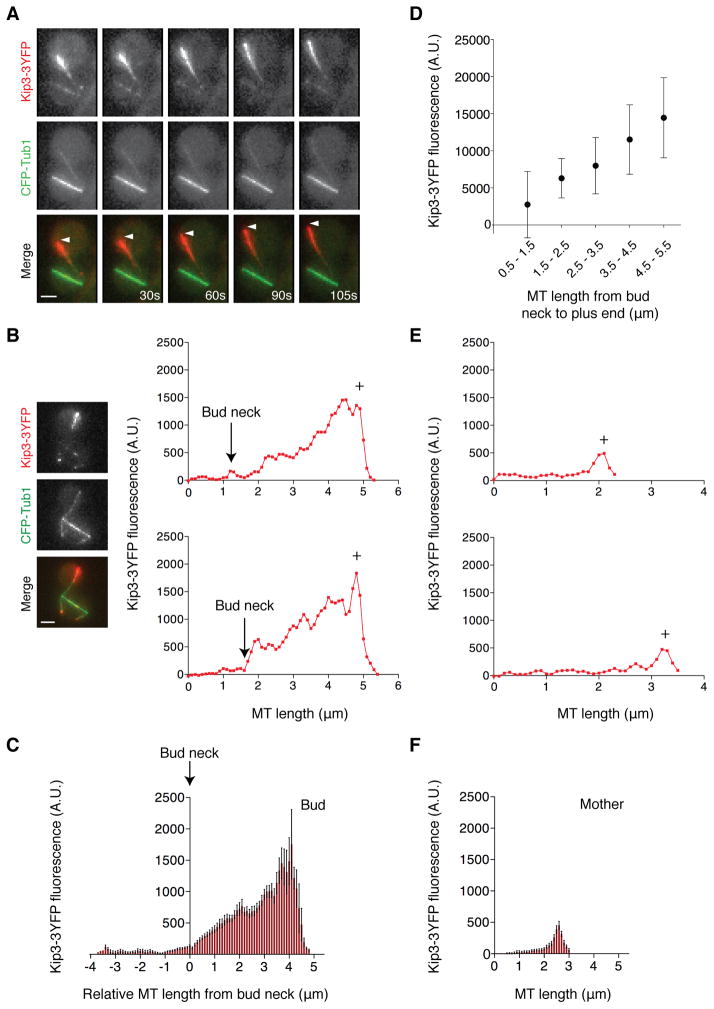
Figure 4. Kip3 accumulates along the length of microtubules in the bud.
(A) Time-lapse images of MTs (CFP-Tub1, green) and Kip3-3YFP (red) in a cell with mispositioned spindle (arrowhead: growing MT). See also Movie S3. (B) Representative examples of Kip3-3YFP fluorescence along bud MTs. The spindle pole is at 0μm and the plus-end (+) is toward the right. Micrographs depict a representative cell. (C) Kip3-3YFP fluorescence along bud MTs aligned so that 0μm represents where each MT crosses the neck. Mean ± SEM. n = 46. (D) Kip3-3YFP fluorescence at the plus-end of growing bud MTs. Mean ± SD.n = 94. (E) Representative examples of Kip3-3YFP fluorescence along mother MTs. (F) Kip3-3YFP fluorescence along mother MTs aligned so their plus-ends overlap at the right. Mean ± SEM. n = 15 MTs with lengths 2–2.6μm. Fluorescence scale is identical in (B, C, E, and F). Scale bars are 2μm. See also Figure S4.

