
Figure 3.
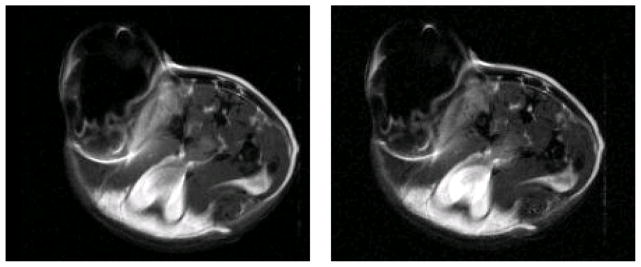
T1 and T2 spin-echo images of directly injected IONP in the MTGB flank tumor of a female C3H mouse. Right: T1 image, TR = 700 ms, TE = 16.38 ms, FOV = 40 × 40 mm, acquisition matrix = 256 × 256, 10 slices, slice thickness = 2mm, one signal average. Left: T2 image, TR = 1500 ms, TE = 40 ms FOV= 40 × 40 mm, acquisition matrix = 256 × 256, 10 slices, slice thickness = 2mm, one signal average. In this situation there is little observable difference between the two techniques.