
Figure 4.
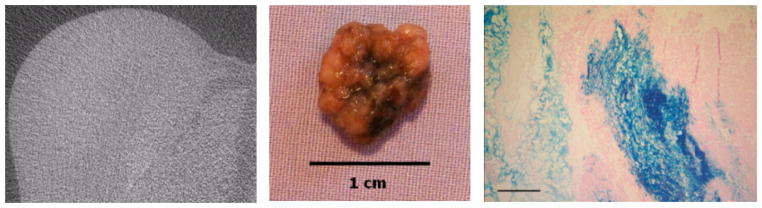
Left: Micro CT images of directly injected IONP in the MTGB mouse mammary tumor. Slice 504 of 835, 40 kvp, 400 mA, resolution 21 microns, 180 degrees, 1/2 degree apart FOV = 12 × 12 mm. In general there is very little resolution of either IONPs or tumor tissue. Center: Excised MTGB tumor tissue 15 minutes following IONP injection. IONP are represented by the black staining which can be seen in higher concentrations at the center of the tumor (site of injection). Right: Microscopic section of a murine mammary tumor demonstrating significant aggregation of IONP in central tumor area immediately following a single injection delivery. It should also be notes that some IONPs are rapidly migrating from the injection region. Prussian Blue stain, 15X, scale bar = 1000 microns