
Figure 5.
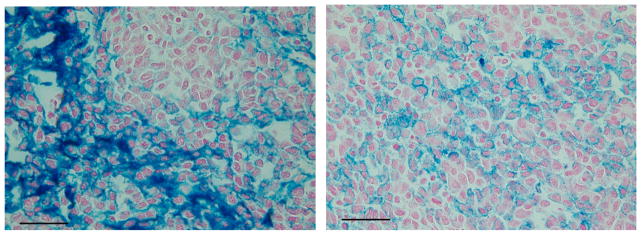
High magnification photomicrographs demonstrating movement and aggregation of IONPs (blue stain) 15 minutes following a single central tumor injection. The photomicrograph on the left demonstrates and area of heavy IONP concentration, while right photomicrograph shows a region of much more evenly distributed IONPs. The fact that the IONPs distribute so well through the tumor and between cells, at such a short incubation time, is encouraging with respect to IONP tumor biodistribution following local tumor injection. Prussian Blue stain, 150X, scale bar =100 microns.