
Figure 6.
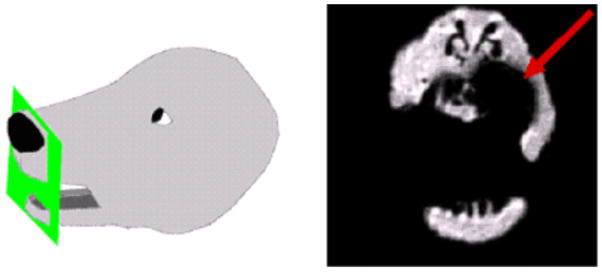
The diagram on the left demonstrates the location of canine oral tumor and MRI slice. The MRI slice (right image) of the tumor 15 days post injection/treatment demonstrates a void that completely obscures the tumor. The SWIFT-MRI imaging technique has the potential to address this issue, resulting in a positive IONP contrast situation. MRI technique use in the figure above: T1 FFE/GR sequence repetition time TR = 550 ms, echo time TE = 2 ms, FOV= 200 mm, acquisition matrix =512 × 512, 54 slice thickness = 2 mm.