
Figure 3.
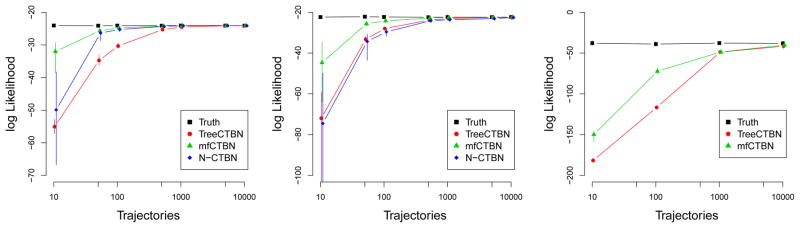
Average testing set log likelihood varying the training set size for each model: Nodelman (left), CV health (center), and S100 (right). N-CTBN averages are omitted on the S100 model as one third of the runs did not terminate.
Official websites use .gov
A
.gov website belongs to an official
government organization in the United States.
Secure .gov websites use HTTPS
A lock (
) or https:// means you've safely
connected to the .gov website. Share sensitive
information only on official, secure websites.
Average testing set log likelihood varying the training set size for each model: Nodelman (left), CV health (center), and S100 (right). N-CTBN averages are omitted on the S100 model as one third of the runs did not terminate.