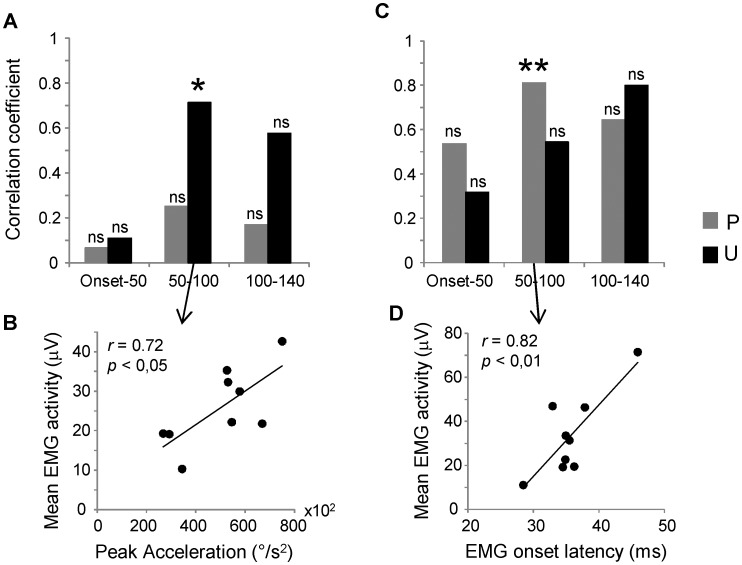
Figure 7. Correlations of mean EMG activity with kinematic and EMG onset latency.
Relationships between mean EMG activity and peak acceleration (A–B) and between mean EMG activity and EMG onset latency (C–D) over the three temporal windows. The regression plots (B–D) are reported only for the correlations displaying a level of significance with p<0.05. Each data point results from the average computed in each subject over ten trials performed during predictable (P) and unpredictable (U) conditions regardless of the load level. ** p<0.01; * p<0.05; ns: not significant.

