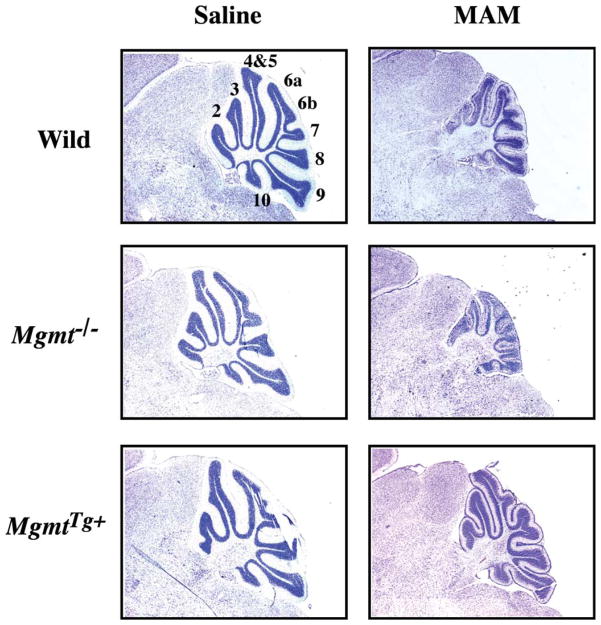
Figure 5.
Cytoarchitecture of the cerebellum of Mgmt KO and Mgmt overexpressing mice treated with MAM. Light micrographs of representative areas from cresyl violet stained parasagittal sections (10 μm) of the PND22 cerebellum from C57BL/6J (Wild), Mgmt KO (Mgmt−/−), or Mgmt-overexpressing (MgmtTg+) mice treated on PND3 with a single subcutaneous injection of saline (left panels) or MAM (325 μmol, right panels). Mag × 3.85. [modified from (Kisby et al., 2009)]

