
Figure 5. The proteasome restrictscaspase activation to axons during axon-specific degeneration.
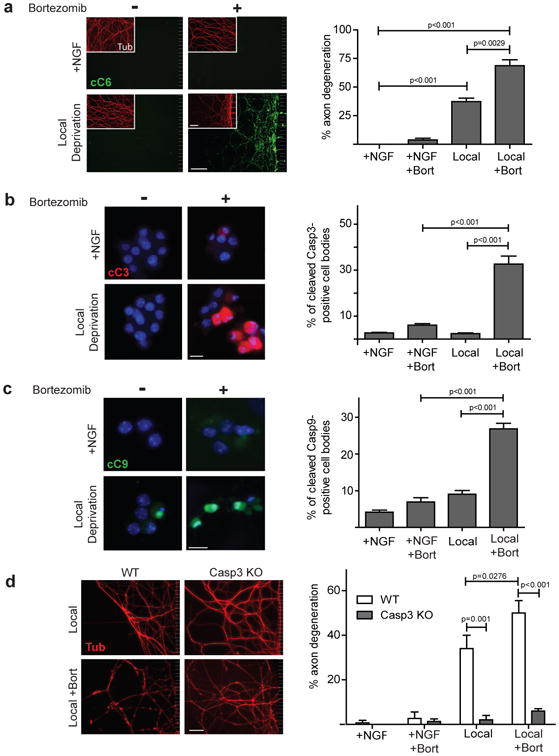
(a) WT neurons were NGF-maintained or locally deprived in the absence (-) or presence (+) of the proteasome inhibitor Bortezomib. Neurons were immunostained for cleaved Casp6 and tubulin (inset). Scale bar, 50 μm. Quantification of axon degeneration is shown on the right. (b) Cell bodies of neurons treated as described in (a) were immunostained for cleaved Casp3. Nuclei were labeled with Hoechst. Scale bar, 20 μm. Quantification of cleaved Casp3-positive cell bodies is shown on the right. (c) Cell bodies of neurons treated as described in (a) were immunostained for cleaved Casp9 and nuclei were labeled with Hoechst. Scale bar, 20 μm. Quantification of cleaved Casp9-positive cell bodies is shown on the right. (d) WT and Casp3-deficient neurons were locally deprived with (+) and without (-) Bortezomib and probed for tubulin. NGF-maintained neurons served as controls. Scale bar, 50 μm. Quantification of axon degeneration is shown on the right. All data represent the mean ± s.e.m. (n=3). All p values were calculated using an unpaired t-test.