
Figure 3.
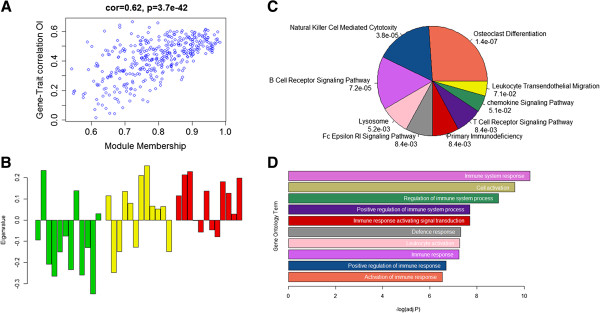
WGCNA module (Blue) associated with immunity. A) Association between the Module Membership and Gene-Trait correlation within the blue module. B) Module eigengene values (y-axis) across samples (x-axis), with the 12 lean animals colored green, the 12 intermediate animals colored yellow and the 12 obese animals colored red. C) Pie chart of all significant KEGG pathways in the blue module. D) The top 10 significant Gene Ontology terms in the Blue module.