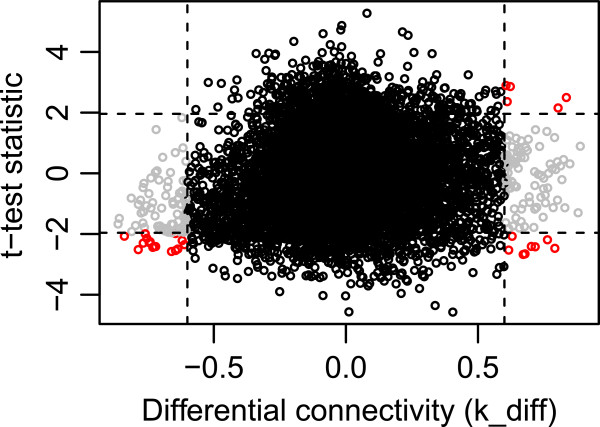
Figure 4.
Plot of the differentially co-expressed genes with on the y-axis thet-test statistic (lean vs. obese) and on the x-axis the differential connectivity. Genes are colored grey when they are differentially connected and colored red if they are also being differentially expressed. In total, 29 genes (19 of which were assigned a gene name) were colored red, which were selected for functional annotation. Discontinuous lines represent thresholds for gene selection: absolute t-test statistic > 1.96 and absolute differential connectivity > 0.6.

