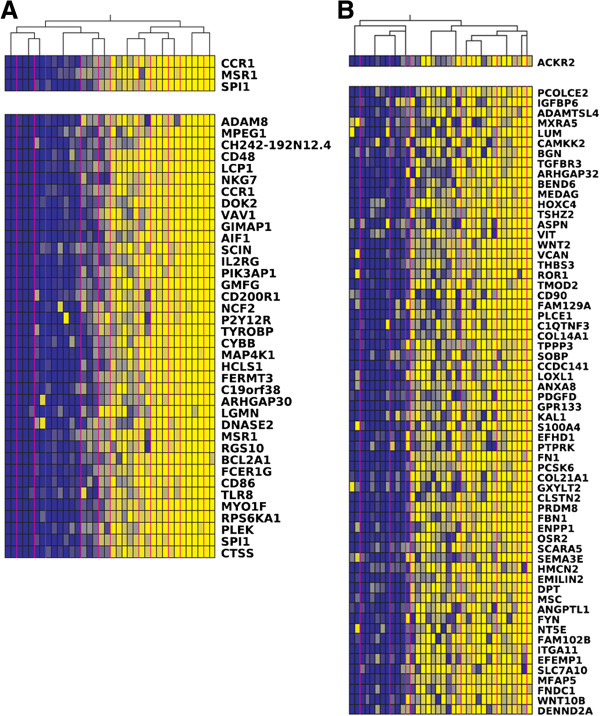
Figure 5.
Color coded expression values of two clusters resulting from the Lemon-Tree algorithm. A) Cluster1, and B) Cluster10. The upper panel represents the high-scoring regulator genes, ordered by their probabilistic score (highest on top). The lower panel represents the genes present in the cluster. Each column represents a sample. The expression of the genes and regulator gene is color coded, with dark blue representing low expression, while bright yellow indicates highly expressed genes. The hierarchical tree on top of the figure is the tree used to assign the regulator gene. The vertical pink colored line represents the partition of samples defined by the first node of the tree.

