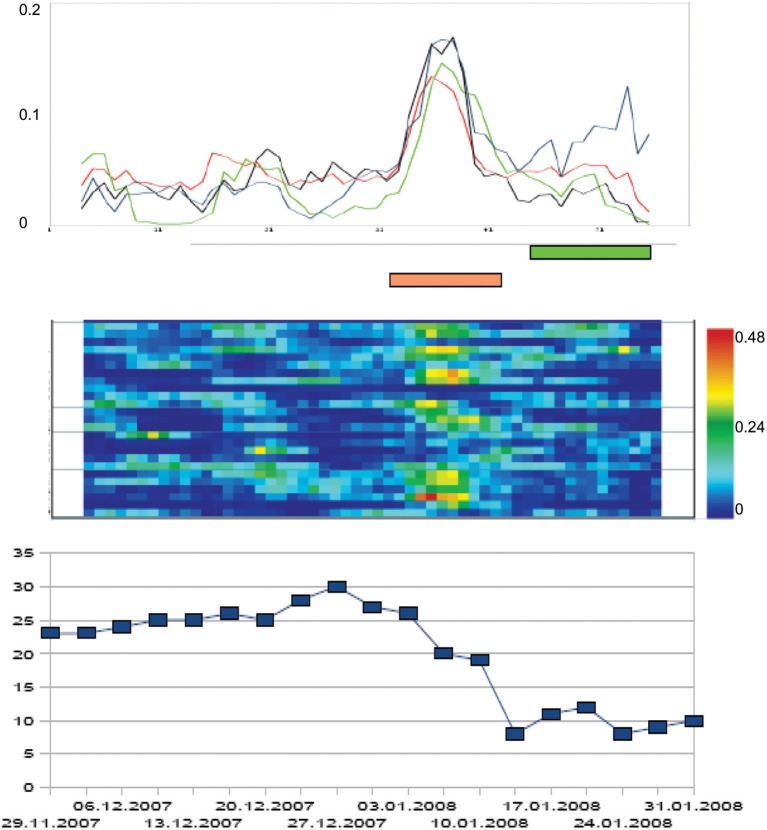
Figure 2.
Order transition during the therapy process of a patient with OCD. The x-axis represents time, i.e., the duration (days) of the psychotherapy in a day treatment center (in this case: 64 days = measurement points). The curves at the top of the diagram represent the dynamic complexity of 4 subscales of the Therapy Process Questionnaire (TPQ): “Therapy progress” (blue), “Complaints and problem pressure” (black), “Dysphoric affects” (red), and “Getting new insights and perspectives” (green; this subscale corresponds to a factor from a former factor analysis of the questionnaire, see Haken and Schiepek, 2010). Dynamic complexity is calculated within an overlapping running window (width: 7 measurement points = days). In the middle part of the figure, the Complexity Resonance Diagram of the therapy process is represented. Each line of the diagram corresponds to an item of the chosen subscales of the TPQ. The dynamic complexity values of the time series of each item are translated into colors (yellow, orange, and red correspond to high complexity values). The lower part of the diagram represents the course of the Y-BOCS which was completed two times per week. The steepest gradient of symptom reduction was realized during the period of critical instability. Brown bar: period of statistically significant increased dynamic complexity. Green bar: Period of ERP.

