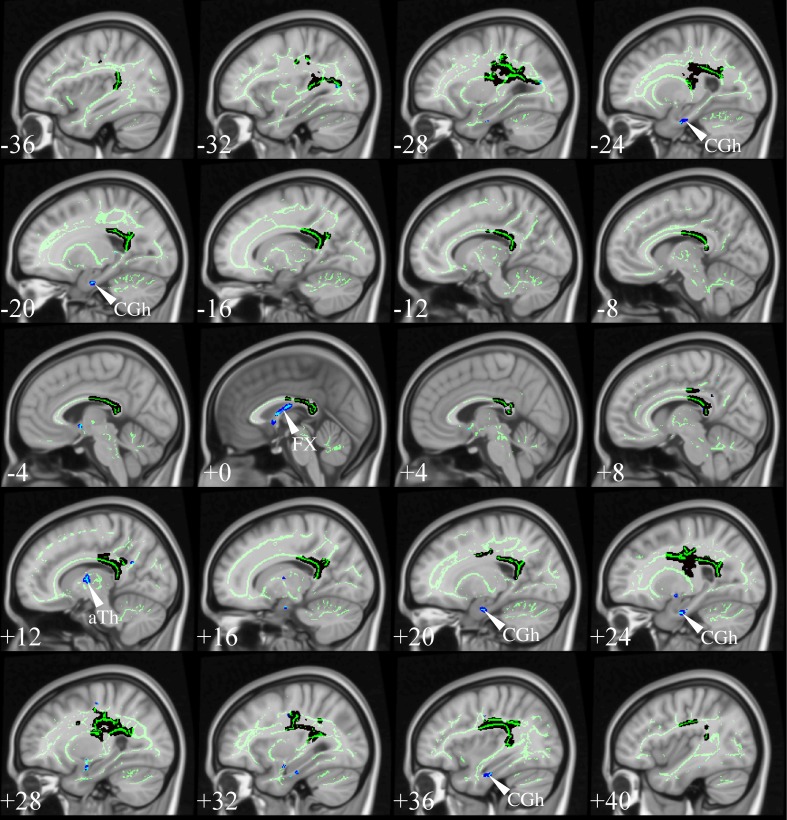
Figure 10.
TBSS in very mild AD. TBSS results for N = 21 very mild AD patients (age: 72 ± 5, <MMSE > = 26 ± 2) vs. N = 26 matched controls (age: 68 ± 6) (Acosta-Cabronero et al., 2012). The patient group included N = 16 subjects who were scanned with a diagnosis of mild cognitive impairment but were subsequently shown to have probable AD with longitudinal follow-up. Black clusters denote increased λ1 in patients at PFWE < 0.05, whereas those in blue represent changes with post-hoc control over the false discovery rate (FDR) at q < 0.05. Thresholded statistical maps are overlaid onto the TBSS skeleton and MNI152 template. Sagittal coordinates are given in millimeter (x < 0 is left). Abbreviations: [aTh] anterior thalamic white matter; [CGh] cingulum at the level of the hippocampus; and [FX] fornix.

