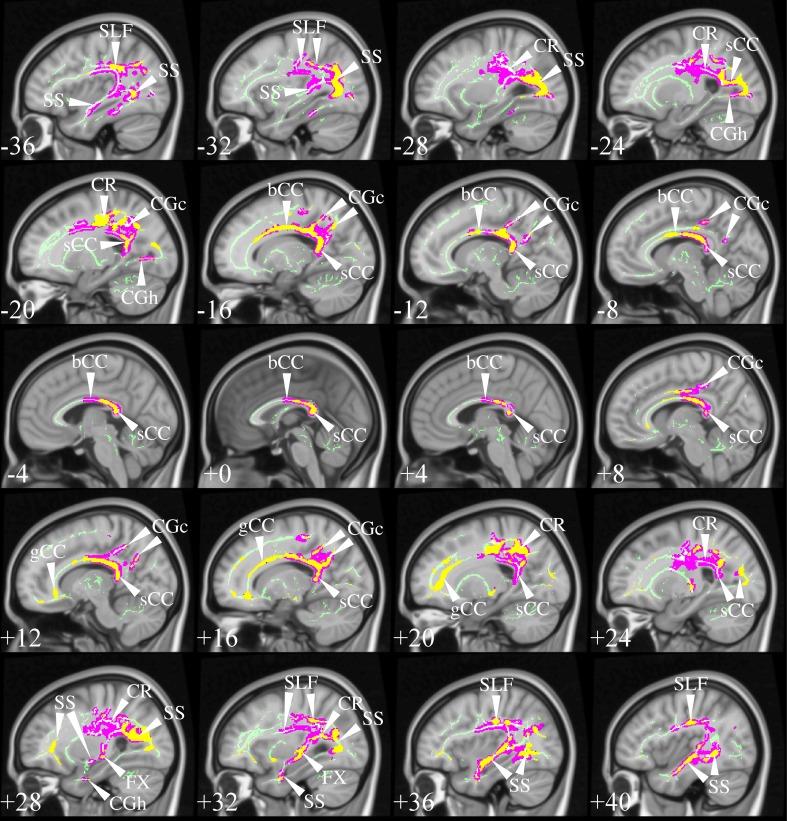
Figure 9.
TBSS in AD. TBSS results for N = 43 early-stage AD patients (age: 70 ± 6, <MMSE > = 24 ± 4) vs. N = 26 matched controls (age: 68 ± 6) (Acosta-Cabronero et al., 2012). Pink clusters denote increased MD in patients, whereas those in yellow represent FA reductions at P < 0.05 enabling threshold free cluster enhancement (TFCE) (Smith and Nichols, 2009) and controlling the family-wise error (FWE) rate. Thresholded statistical maps are overlaid onto the TBSS skeleton and MNI152 template. Sagittal MNI coordinates are given in millimeter where x < 0 is left. Abbreviations: [SLF] superior longitudinal fasciculus; [SS] sagittal stratum; [CR] corona radiata; [s/b/gCC] splenium/body/genu of the corpus callosum; [CGc/h] cingulum at the level of the posterior cingulate/parahippocampus; and [FX] fornix.

