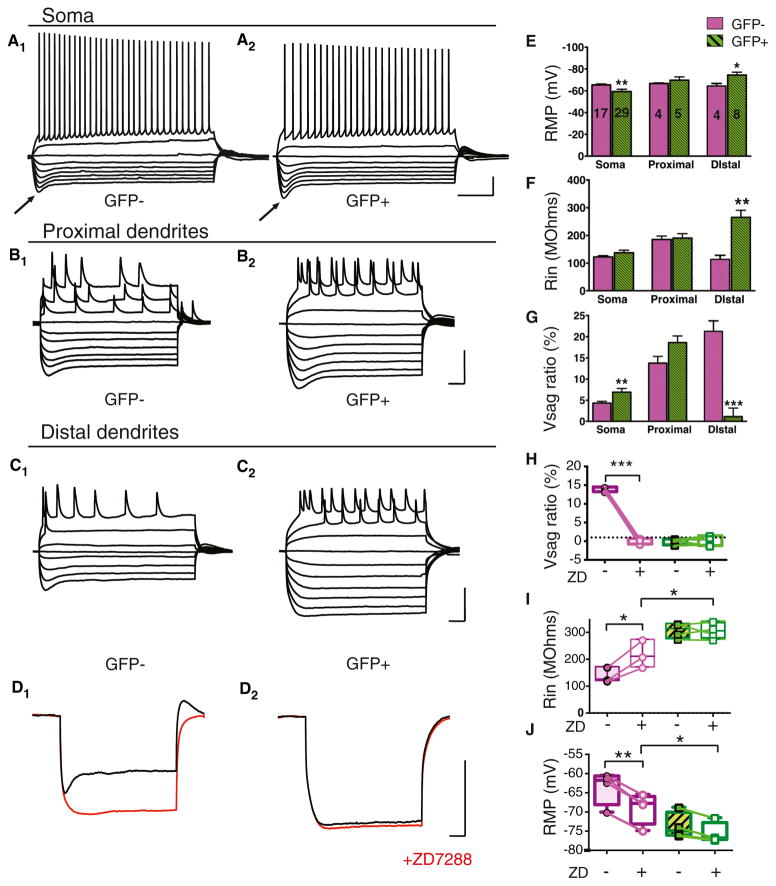
Figure 3. Dab1 Knockdown Reduces Ih Selectively in Distal Dendrites of CA1 PNs.
(A) Whole cell current clamp voltage recordings from soma of Cre-GFP− (A1) and Cre-GFP+ (A2) CA1 PNs. Voltage responses are shown to a series of hyperpolarizing and depolarizing current pulses. Arrows point to pronounced voltage sag following strongest hyperpolarization responses in Cre-GFP−and Cre-GFP+ neurons. Scale bars represent 20 mV, 0.2 s.
(B) Whole cell current clamp recordings from proximal dendrites of Cre-GFP− (B1) and Cre-GFP+ (B2) CA1 neurons. Scale bars, 50 mV, 0.1 s.
(C) Whole cell current clamp recordings from distal dendrites of Cre-GFP− (C1) and Cre-GFP+ (C2) CA1 neurons. Scale bars, 50 mV, 0.1 s. Note pronounced voltage sag with strongest hyperpolarizations in recordings from GFP- but not GFP+ PN distal dendrites.
(D) Whole cell current clamp voltage recordings from distal dendrites in Cre-GFP− (D1) and Cre-GFP+ (D2) neurons before (black traces) and after application of 10 μM ZD7288 (red traces). Scale bars, 50 mV, 0.1 s.
(E) Resting membrane potential (RMP in mV) of Cre-GFP− (control, magenta) and Cre-GFP+ (Dab1 knockdown, green) neurons. Dab1 knockdown caused a significant negative shift in the RMP in distal dendrites (p = 0.036) and a significant positive shift in RMP in the soma (p = 0.006). Number of cells for each condition are displayed on graph.
(F) Dab1 knockdown caused a significant increase in mean input resistance (Rin) selectively in distal dendrites (p = 0.003).
(G) Dab1 knockdown significantly increased the voltage sag ratio (Vsag ratio) in the soma (p = 0.004) and significantly decreased Vsag ratio in the distal dendrites (p = 0.0002). Vsag ratio was measured as (Vpeak – Vsteady-state)/Vpeak × 100%, where Vpeak is the maximal hyperpolarized voltage and Vsteady-state is the steady-state voltage in response to a given hyperpolarizing current step relative to membrane holding potential.
(H) Vsag ratio measured in distal dendrites of Cre-GFP− and Cre-GFP+ neurons before and after application of ZD7288. ZD7288 significantly decreased sag only in Cre-GFP− neurons (paired t test, p < 0.0001). Plot shows individual cells, min to max (whiskers), median (line), and 25th to 75th percentiles (box).
(I) Rin measured in distal dendrites of Cre-GFP− and Cre-GFP+ neurons before and after application of ZD7288. ZD7288 significantly increased Rin in Cre-GFP− neurons (paired t test, p < 0.0001). In the presence of ZD7288, Rin was significantly greater in Cre-GFP+ neurons than in Cre-GFP− neurons (p = 0.035). (J) RMP in distal dendrites of Cre-GFP− and Cre-GFP+ neurons before and after application of ZD7288 (red traces). ZD7288 caused a significant negative shift in the RMP of Cre-GFP− neurons (paired t test, p = 0.001). In the presence of ZD7288, RMP was significantly more negative in Cre-GFP+ neurons than in GFP-neurons (p = 0.036).
See also Figure S7.

