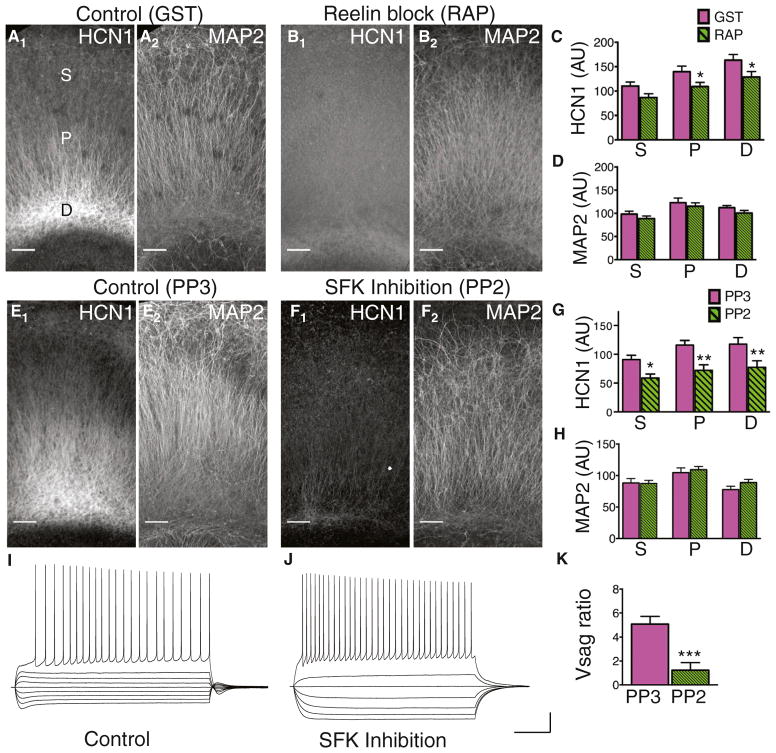
Figure 6. Effects of Reelin and SFK Inhibition on HCN1 Expression and Localization in Organotypic Cultures.
(A) Image of the CA1 region from a control organotypic culture stained for HCN1 (A1) and MAP2 (A2). Somatic (S), proximal (P), and distal (D) regions of the apical dendrite are labeled in (A1). To show the brain region in which the analysis was performed, maximum intensity z projection images were tiled. Scale bar, 100 μm for all images.
(B) Image of the CA1 region from an organotypic culture treated with RAP to block Reelin activity and stained for HCN1 (B1) and MAP2 (B2).
(C) Mean HCN1 intensity in the CA1 region of control and RAP-treated cultures. HCN1 was significantly reduced in proximal (p = 0.040) and distal regions (p = 0.049), but not in the somatic region (p = 0.054) of Dab1 knockdowns (n = 12,19).
(D) Mean MAP2 intensity was not significantly different in control and RAP-treated cultures.
(E) Image of the CA1 region from an organotypic culture treated with the inert analog PP3 and stained for HCN1 (E1) and MAP2 (E2).
(F) Image of the CA1 region from an organotypic culture treated with the SFK inhibitor PP2 and stained for HCN1 (F1) and MAP2 (F2).
(G) Mean HCN1 staining intensity in CA1 of PP3 (control) and PP2-treated cultures. HCN1 was significantly reduced in somatic (p = 0.059), proximal (p = 0.003), and distal (p = 0.023) regions in PP2 versus PP3-treated cultures (n = 10,10).
(H) Mean MAP2 intensity in PP2- and PP3-treated cultures.
(I) Whole cell current clamp voltage recording from a CA1 PN in a PP3-treated (control) culture in response to a series of hyperpolarizing and depolarizing current steps. Note prominent sag upon hyperpolarization. Scale bars, 20 mV, 200 ms (I and J).
(J) Whole cell current clamp voltage recording from a CA1 PN in a PP2-treated culture in response to identical current steps used in (I). Note lack of sag.
(K) Mean Vsag ratio was significantly reduced in PP2-treated versus PP3-treated control cultures (p = 0.001).

