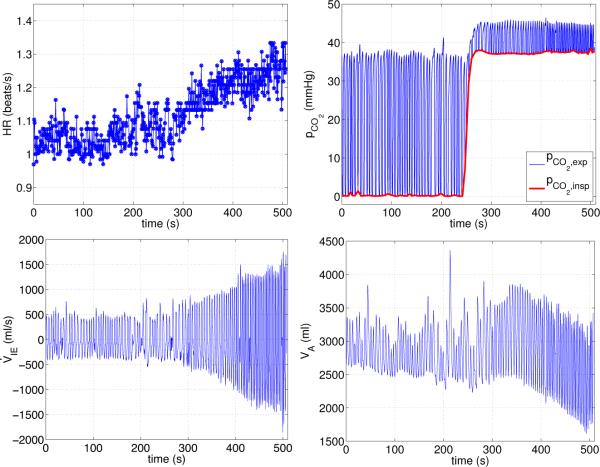
Figure 2.
Input to the model from experimental data. Top row: Heart rate (left panel) and inspired partial pressure of CO2 (marked with a red line on the right panel). These values are obtained by fitting a smooth spline through minimum values of expiratory CO2 partial pressures. Bottom row: Inspired airflow (left panel) and alveolar volume (right panel).

