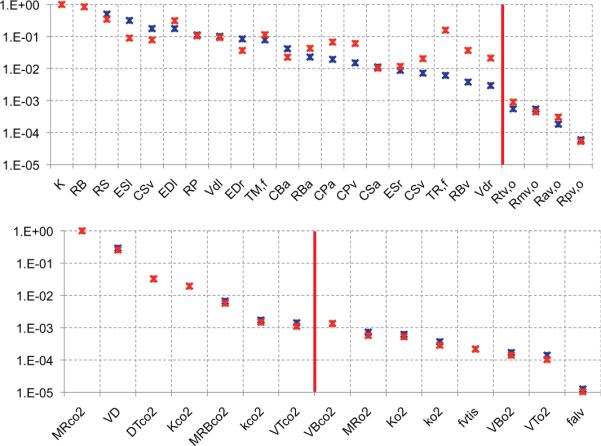
Figure 5.

Ranked sensitivities for the cardiovascular and respiratory models. The top graph shows ranking for the cardiovascular model and bottom graph shows ranking for the respiratory model. For both graphs, blue stars denote sensitivities computed using the initial (nominal) parameter values, and the red stars denote sensitivities computed using the optimized parameters. Note, that the y-axis is a log scale.
