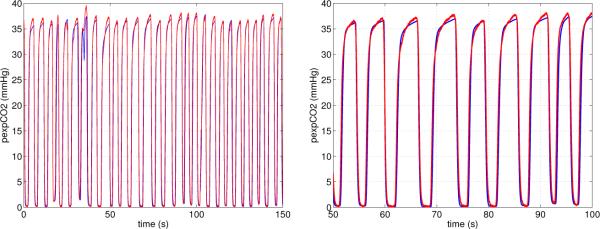
Figure 7.

Steady state simulation results from the respiratory model. The graphs show expiratory CO2 partial pressure as a function of time. The left graph shows results over the complete time-series, while the right graph show a zoom for 50 ≤ t ≤ 100 seconds.
