
Figure 8.
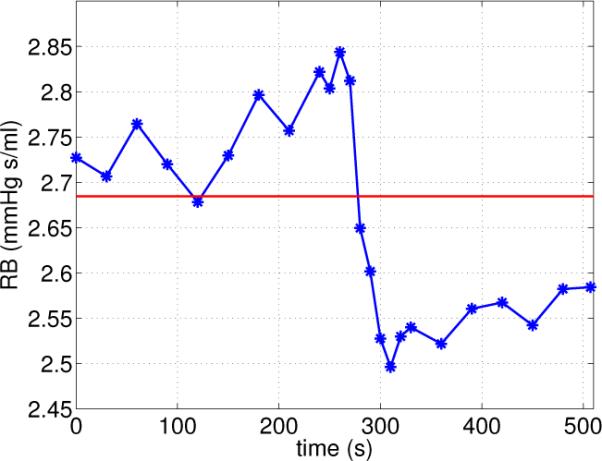
Autoregulation of cerebral vascular resistance RB. The red horizontal line shows the value obtained during eucapnia, while the time-varying blue line shows dynamics obtained during hypercapnia.
Official websites use .gov
A
.gov website belongs to an official
government organization in the United States.
Secure .gov websites use HTTPS
A lock (
) or https:// means you've safely
connected to the .gov website. Share sensitive
information only on official, secure websites.
Autoregulation of cerebral vascular resistance RB. The red horizontal line shows the value obtained during eucapnia, while the time-varying blue line shows dynamics obtained during hypercapnia.