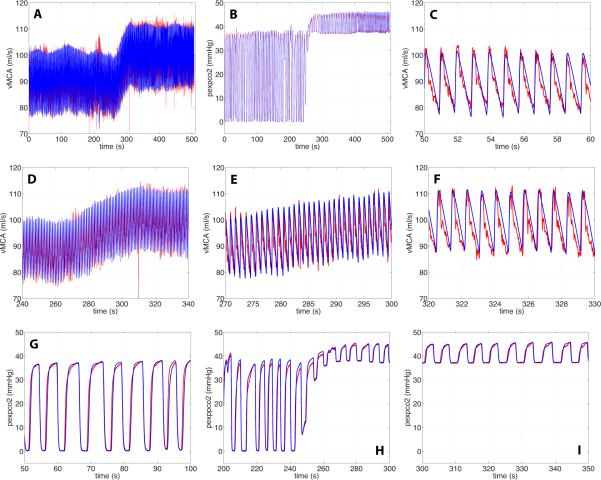
Figure 9.
Simulation results from the coupled model with controls. Panels A and B show the entire time-series predicting cerebral blood flow velocity and expiratory CO2 partial pressure. Panels C-F show zoomed snapshots of cerebral blood flow velocity during normal breathing C, during the transition D and E, and during hypercapnia F. Panels G-I show zoomed snapshots of expiratory CO2. G shows dynamics during normal breathing, H during the transition, I during hypercapnia. For all graphs the blue line denotes computed results, while the red line mark the associated experimental data.

