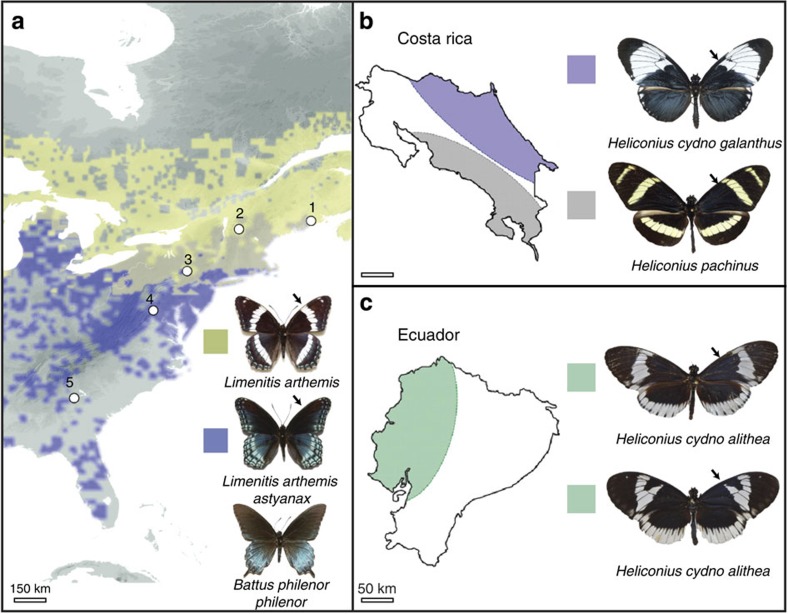
Figure 1. Biogeographic distribution of study populations.
(a) Parapatric distribution of hybridizing mimetic (L. a. astyanax) and non-mimetic (L. a. arthemis) admiral butterflies (distribution data from BAMONA59). White dots indicate population samples; note that the toxic model, B. philenor, geographically overlaps with the distribution of the mimetic form of Limenitis60. (b) Parapatric distribution of H. c. galanthus and H. pachinus in Costa Rica. (c) Sympatric distribution of H. c. alithea in Ecuador. Black arrows illustrate medial pattern polymorphism on the forewing. Black arrows in each panel highlight variation in the melanic forewing pattern of each species. Scale bars in kilometres.

