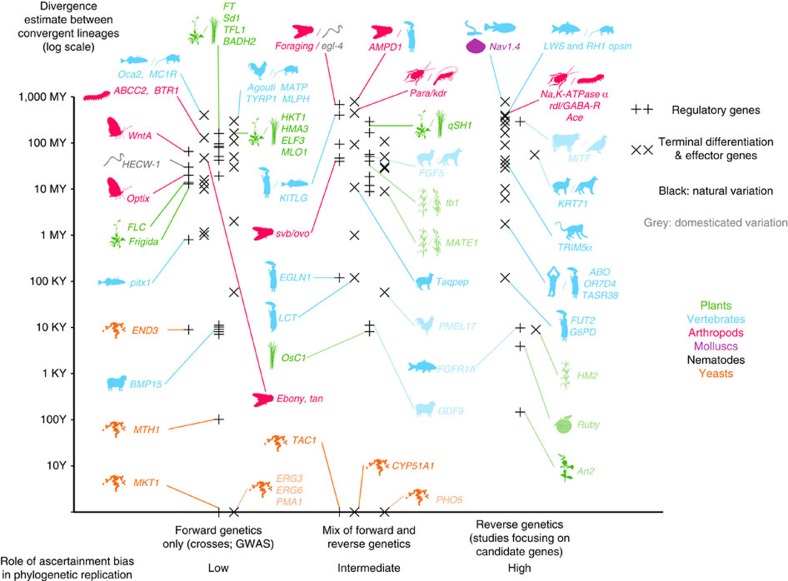
Figure 6. The empirical landscape of parallel genetic evolution.
The graph features 118 genes involved in parallel genetic evolution, where de novo mutations have independently driven phenotypic evolution of a phenotypic trait in at least two lineages. The y axis marks the estimated divergence time between the two lineages (for genes with >2 entries, the most distant pair is shown). The literature is also partitioned across the x axis according to criteria thought to influence the discovery of parallel genetic evolution: (1) type of ascertainment bias on the genetic nature of the trait38; (2) cases of natural variation versus cases including domesticated variation38; and (3) regulatory versus terminal differentiation and effector genes39. See Supplementary Data 1–3 for data and references.

