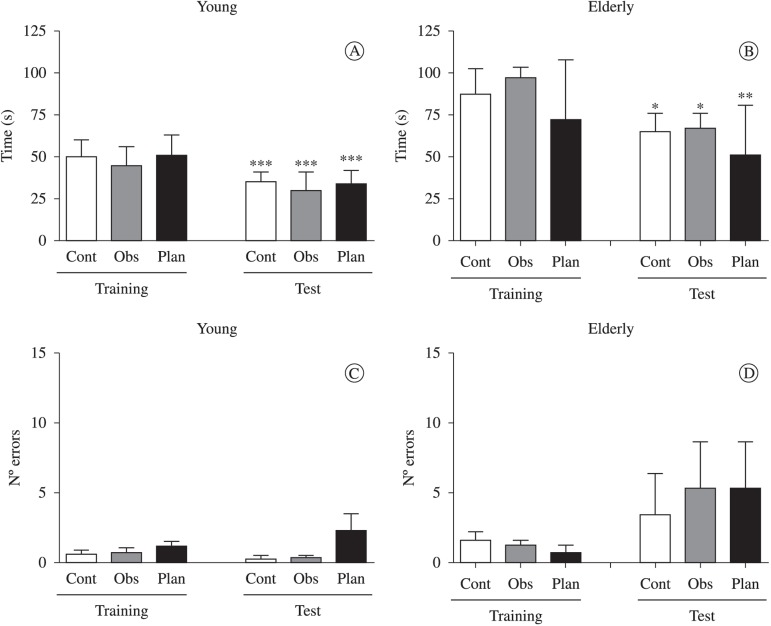
Figure 2.
Comparison between time (figures A and B, median ± interquartile range, Wilcoxon test) and the number of runtime errors (figures C and D, mean ± standard deviation, Student's t test for dependent samples) in the motor task when performed by young adults (figures A and C) and the elderly (Figures B and D) during training and testing (n=15/group, * P<0.05, ** P<0.01, *** P<0.001 compared to training the same subgroup).

