
Figure 3.
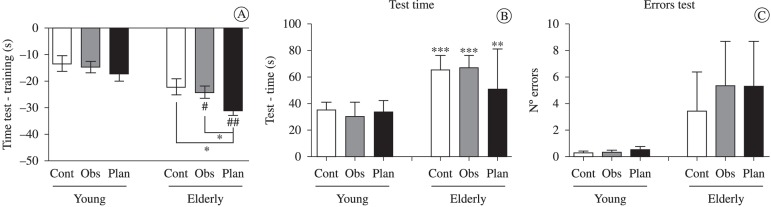
Comparison of the performances of young adults and the elderly on the motor task test showing the difference in the time required for the execution of the motor task in testing and training (figure A; median ± standard error of the Mann-Whitney test; # P<0.05, # # P<0.01 compared with the same young subgroup, * P < 0.05 compared to the control elderly subgroup); execution time (Figure B, median ± interquartile range test; Mann-Whitney test, ** P<0.01 compared to the youth of the same subgroup; *** P<0.001 compared to the same young subgroup) and the number of errors (Figure C, mean ± standard deviation, t-test of independent samples) (n=15/group).